Pushing the Pace in
a Resurgent Sri Lanka
a Resurgent Sri Lanka
The value created by the Bank for itself through activities, relationships and linkages leads to the formation of capital that is internal to the Bank. While what is most visible and quantifiable is financial capital, internal capital also includes several intangibles that constitute institutional capital.
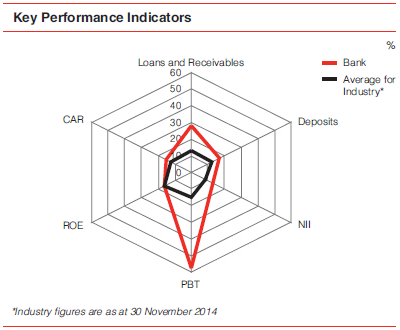
We achieved sound growth in business volumes and maintained commendable profitability, while staying ahead of industry performance. The precise execution of a carefully articulated strategy by a team of dedicated, customer-centric and competent professionals, within an atmosphere of good governance and total compliance has enabled superior performance that has made the Bank one of the most respected entities within the industry.
The following radar chart and graphs show how the Bank’s KPIs have performed in relation to the industry.
Note: The financial performance of the Bank and the Group for the year ended 31 December 2014 ('year under review' or '2014') is discussed in comparison with the financial results for the year ended 31 December 2013 (‘2013’). The Group's subsidiary, NDB Capital Holdings PLC (NCAP) earned an exceptional equity income of LKR 6,031 million through the strategic divestment of AVIVA NDB Insurance PLC to American International Assurance (AIA) Company Limited of Hong Kong in December 2012, which was transferred to the Bank from the Group in March 2013 via a share buyback agreement with NCAP. Accordingly, the financial performance of the Bank in the comparative period (2013) is inclusive of this one-off equity income, and where necessary, the performance of the comparative period will be referred to excluding the one-off equity income.
| Bank | Group | |||||||
|
2014 LKR million |
2013* LKR million |
Change in
LKR million |
Change % |
2014 LKR million |
2013 LKR million |
Change in LKR million |
Change % | |
| Gross income | 24,962 | 23,625 | 1,337 | 6 | 26,205 | 25,303 | 902 | 4 |
| Net interest income | 7,675 | 6,812 | 863 | 13 | 7,914 | 7,012 | 902 | 13 |
| Total operating income | 11,662 | 9,834 | 1,828 | 19 | 12,966 | 11,549 | 1,417 | 12 |
| Impairment for loans and receivables and other losses | 566 | 1,238 | (672) | (54) | 529 | 1,261 | (732) | (58) |
| Operating expenses | 5,309 | 4,944 | 365 | 7 | 5,911 | 5,564 | 347 | 6 |
| Operating profit before taxon financial services | 5,787 | 3,651 | 2,136 | 59 | 6,527 | 4,724 | 1,803 | 38 |
| Share of profit from associate companies | – | – | – | – | 97 | 49 | 48 | 98 |
| Profit after tax | 3,418 | 2,079 | 1,339 | 64 | 4,246 | 2,712 | 1,534 | 57 |
| Profit attributable to shareholders | – | – | – | – | 4,134 | 2,642 | 1,492 | 56 |
*Excluding the one-off equity income of LKR 6,031 million, earned by the Bank.
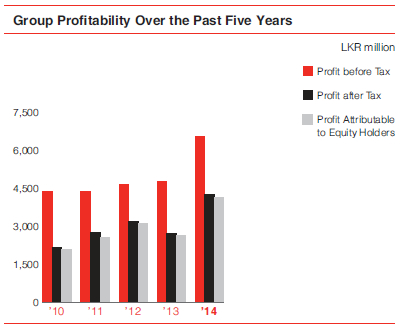
The Bank's profit for the year was LKR 3,418 million, compared to LKR 7,723 million for the year 2013. Though the reported numbers indicate a decline of 56%, it must be noted that the Bank’s profit for the year grew by 64% if the one-off equity income earned during the year 2013 was excluded.
At the Group level, profit for the year increased by 56% from LKR 2,712 million in 2013 to LKR 4,246 million in 2014, indicating robust growth across all segments.
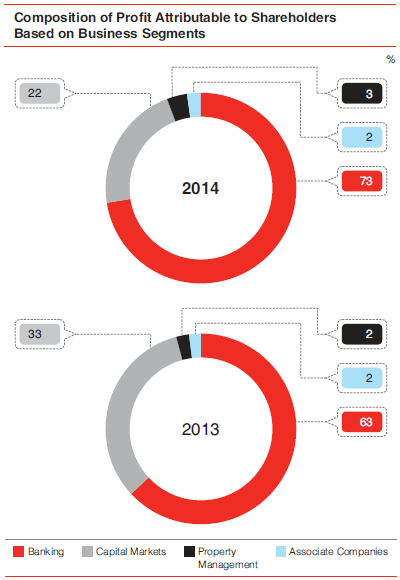
PAS crossed the LKR 4 billion mark to reach LKR 4,134 million, an impressive growth of 56% over the LKR 2,642 million recorded in 2013. This significant growth was achieved through increased performance of both core banking operations and the capital market cluster of the Group.
Gross income, comprising of interest income, net fee and commission income, net gains/(losses) from trading, net gains/(losses) from financial investments and other operating income recorded a 4% increase at Group level to reach LKR 26,205 million for the year. The Bank's gross income for the year was LKR 24,962 million, a growth of 6% over the previous year, excluding the one-off equity income noted previously.
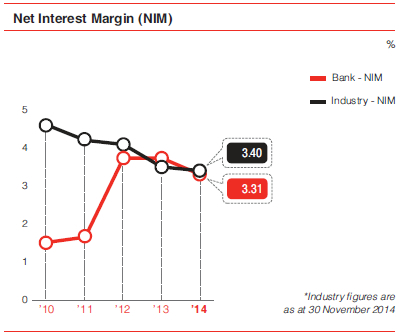
The NII of the Bank increased by 13% to LKR 7,675 million during the year, in comparison to LKR 6,812 million of the previous year. The growth rate compares well with the industry NII growth rate, in a low interest rate environment coupled with less than anticipated credit growth from the private sector. The Bank’s focus on the strategic structuring of the balance sheet and skilful asset and liability management, amidst these challenges contributed to this success.
Within NII, the interest income of the Bank increased by 2% due to the increase in the interest generating asset base, despite reduction in interest yields, whilst Interest expenses declined by 4%, resulting from the effective management of the borrowing composition of the Bank to support asset growth.
Total operating income comprising of net interest income, net fee and commission income, net gains/(losses) from trading, net gains/(losses) from financial investments and other operating income grew by 12% at the Group level from LKR 11,549 million in 2013 to LKR 12,966 million in 2014. At the Bank level, total operating income showed a decline of 26% due to the one-off equity income included in the performance for 2013, which if excluded, records a 19% growth over 2013.
Apart from NII, the Bank also earns fees and commission income from lending, deposit mobilising, trade finance activities, card operations, remittance services, bancassuarance, etc. The Bank’s fee and commission income recorded a commendable growth of 16% over the comparative year to reach LKR 1,866 million for the year, due to the increased business volumes during the year.
The NDB subsidiaries, which primarily carry out fee-based capital market businesses and rental based property management, also contributed significantly to the Group’s fee and commission income during the year. The Group’s fee and commission income grew by 6% to reach LKR 2,564 million during the year. With the revamping of our card operations and a strategic focus on cross selling within the business units of the Bank and the Group, we expect the Group’s fee and commission income to be scaled up further, in the years to come.
The income from trading activities primarily consists of forex profits, both trading and sales, which declined by 5% to reach LKR 910 million in 2014. The decline is mainly due to the LKR/USD swap cost of funding being absorbed during the year, the benefits of which are reflected in the NII. The net trading income/(losses) excluding the swap cost shows a 6% increase over the previous year.
The low interest rate environment that prevailed in 2014 enabled the Bank to benefit from volatilities in the securities trading market. As a result, the Bank’s marked to market profits increased by 125% over the previous year’s LKR 318 million to reach LKR 717 million for the year under review.
Impairment for loans and receivables and other losses for the year ended 31 December 2014 was LKR 566 million and compares with a charge of LKR 1,238 million in 2013. The significant decline in the impairment charge over the comparative period was primarily due to one-off provisions made for a few significantly impaired loan facilities during the last quarter of 2013. This impairment charge represents the Bank’s sound judgment in assessing the fair value of the impaired loans, based on objective evidence of future recoveries and is in accordance with the Bank’s stringent risk management policies.
The Bank applies its risk management framework for the risk assessment of individual loans and for collective provisions, which considers past due status, loss data and the economic factors relevant to each portfolio segment. The Bank continuously makes improvements to the methodology adopted for the impairment computation process. There were no significant adjustments to the provisions as a result of such changes/improvements during the year.
The Bank follows the Sri Lanka Accounting Standards LKAS 32 - 'Financial Instruments: Presentation', LKAS 39 - 'Financial Instruments: Recognition and Measurement', and a Board approved impairment policy in arriving at the impairment provision.
There are no additional impairment charges for loans and advances for Group subsidiaries as their portfolios contain only staff loans, which are recovered through the payroll.
|
2014 LKR million |
2013 LKR million |
|
| Impairment allowance for loans and receivables to other customers | 5,014 | 4,187 |
| Total loans and receivables to other customers | 180,501 | 141,009 |
| Percentage of impairment allowance (%) | 2.78 | 2.97 |
Total operating expenses of the Group increased by 6% from LKR 5,564 million in 2013 to LKR 5,911 million during the year. Total operating costs at the Bank level too increased by 7% from LKR 4,944 million in 2013 to LKR 5,309 million in 2014. The increase in operating costs was amidst aggressive business expansion across the Bank and the Group, the benefits of which will accrue over the coming years.
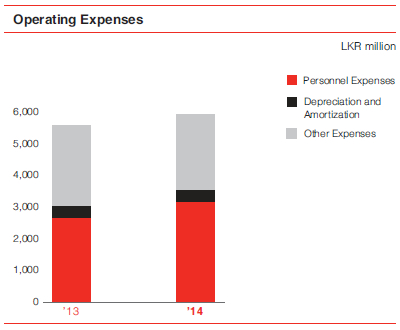
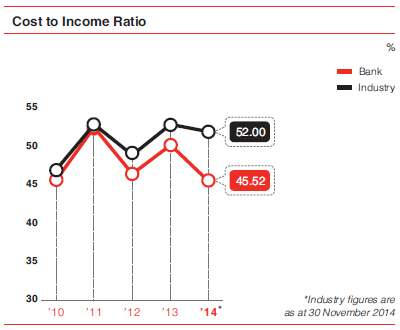
Operational excellence and cost optimization are two strategic priorities of the Group. Benefiting from the synergies of these two complementing imperatives, the Bank and the Group recorded one of lowest cost to income ratios (CIR) within the industry. The Bank’s CIR for 2014 was 45.52% compared to 50.12% in 2013 after excluding the one-off equity income.
The Bank and the Group operate one of the leanest and efficient operating structures, with a host of support functions centralized. Such a set-up allows the Group to further improve its CIR in the future.
The Group’s operating profit before tax on financial services recorded a 38% increase to LKR 6,527 million, compared to LKR 4,724 million for the year 2013. The corresponding results for the Bank indicated a growth of 59% over the previous period to reach LKR 5,787 million for the year, when the one-off equity income is excluded, as explained previously.
The overall effective tax rates for the Bank and the Group for income taxes and taxes on financial services were 40.9% and 36.4% respectively, and compares with the total statutory effective tax rate of 42%. The lower effective tax rate for the Group was primarily due to the fee-based nature of the principal activities of the subsidiaries and the investment income on unit trusts being exempt from Income Tax.
The Bank’s contribution to the Government of Sri Lanka via Income Tax and Taxes on financial services increased by 27% to LKR 2,242 million in 2014, from LKR 1,765 million in 2013.
| Bank | Group | |||||||
|
2014 LKR million |
2013 LKR million |
Change in LKR million |
Change % |
2014 LKR million |
2013 LKR million |
Change in LKR million |
Change % |
|
| Total assets | 262,729 | 201,259 | 61,470 | 31 | 269,130 | 206,817 | 62,313 | 30 |
| Gross loans and receivables | 180,501 | 141,650 | 38,851 | 27 | 180,561 | 141,711 | 38,850 | 27 |
| Investments | 69,138 | 52,242 | 16,896 | 32 | 72,971 | 55,691 | 17,280 | 31 |
| Total liabilities | 240,491 | 181,638 | 58,853 | 32 | 240,331 | 181,455 | 58,876 | 32 |
| Customer deposits | 151,824 | 129,830 | 21,994 | 17 | 151,485 | 129,422 | 22,063 | 17 |
| Borrowings | 80,134 | 46,557 | 33,577 | 72 | 80,104 | 46,527 | 33,577 | 72 |
| Shareholders’ funds | 22,238 | 19,620 | 2,618 | 13 | 27,876 | 24,514 | 3,362 | 14 |
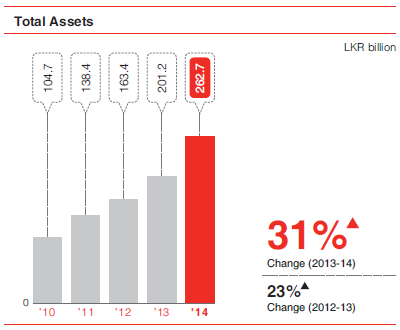
Total assets of the Bank grew by a commendable 31% in 2014 to reach LKR 262,729 million, from LKR 201,259 million in 2013. This growth level is well above the average industry asset growth rate and has been achieved amidst a challenging industry climate of reduced credit growth. The asset book of the Bank grew by 27% over the year 2013, across all business lines including corporate loans, project and infrastructure financing loans, retail loans and micro and SME loans. The growth in each individual business line is a strong affirmation of the Bank’s commitment in nourishing and nurturing the country’s growing and demanding economy.
The Bank’s financial investments, which are primarily in government securities (and categorized as loans and receivables, available for sale, held for trading or held to maturity), also contributed towards the increase in the asset base by recording a 32% growth.
The Bank revised its accounting policy on the valuation of the land and buildings during the year from a ‘cost’ model to a ‘revaluation model’, in line with Sri Lanka Accounting Standards 18 - ‘Property, Plant & Equipment’, resulting in a revaluation surplus of LKR 1,084 million to the Bank’s asset base.
Gross loans and receivables grew by 27% during the year under review to reach LKR 180,501 million from LKR 141,650 million as at 31 December 2013. This growth rate is also well above the industry average.
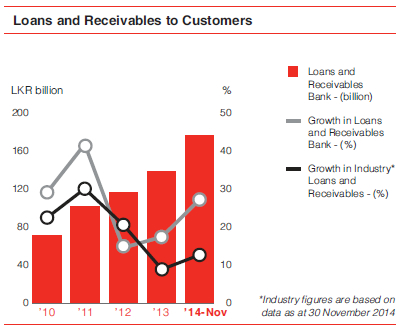
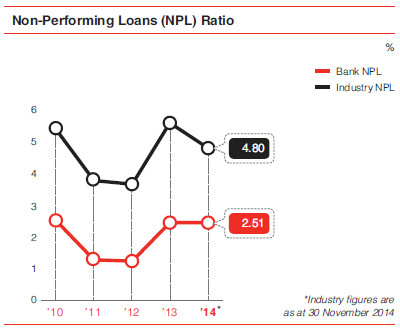
The Non-Performing Loan ratio (NPL) of the Bank as at 31 December 2014 was 2.51% and was marginally higher than the ratio of 2.48% recorded in the previous year. The NPL ratio of the Bank has remained well below the industry norms.
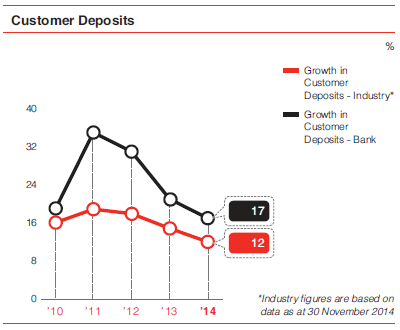
Customer deposits grew by 17% during the year to LKR 151,824 million (end 2013: LKR 129,830 million). Customer deposits contributed 65% of the total funding base as at 31 December 2014.
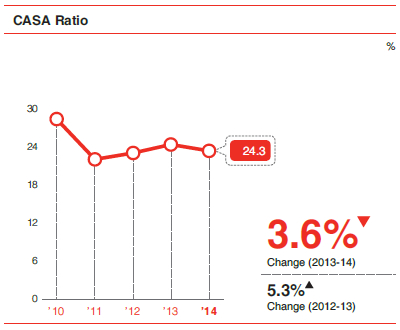
It is noteworthy to mention that the CASA ratio declined only marginally from 25% to 24% during the year despite the low interest rate environment in the country.
The Bank's Loans to Deposits Ratio was 119% as at 31 December 2014 (2013: 109%). The Bank utilized the approval given by the Central Bank of Sri Lanka for licensed commercial banks to borrow up to USD 50 million and the specific approval given to National Development Bank PLC to borrow up to USD 250 million in excess of the 15% of the Bank’s capital by direction dated 17 April 2013. Accordingly the Bank raised USD 200 million during the year through a syndication facilitated by International Finance Corporation (IFC). With the said borrowing and the stagnant trend in deposit growth experienced in the industry, improving the Bank’s Loans to Deposit Ratio remains challenging.
The Bank continues to manage and ensure an effective mix of advances and deposits, to maximize profitability and maintain a sound liquidity position at all times.
Debt securities and other borrowed funds comprise of institutional borrowings (both foreign and local), securities sold on repurchase agreements and money market borrowings. The borrowings portfolio is managed and used for both short term and long term funding needs of the Bank. The portfolio increased by LKR 37,535 million during the year.
The funds raised through the syndication facilitated by the IFC, included under debt securities issued and other borrowed funds, were infused to the SME sector of the country and other sectors that contribute towards national development. The syndication saw several leading international banks and development financial institutions lending to the Bank (with some of them lending to Sri Lanka for the first time), which reflects the growing confidence the international financial fraternity has placed in the Bank as well as Sri Lanka at large.
| Bank | Group | |||||||
|
2014 LKR million |
2013 LKR million |
Growth in LKR million |
Percentage growth |
2014 LKR million |
2013 LKR million |
Growth in LKR million |
Percentage growth |
|
| Due to banks | 7,029 | 10,453 | (3,424) | (33) | 7,029 | 10,453 | (3,424) | (33) |
| Debt securities and other borrowed funds | 61,956 | 24,421 | 37,535 | 154 | 61,926 | 24,391 | 37,535 | 154 |
| Subordinated term debts | 11,149 | 11,683 | (534) | (5) | 11,149 | 11,683 | (534) | (5) |
| Total borrowings | 80,134 | 46,557 | 33,577 | 72 | 80,104 | 46,527 | 33,577 | 72 |
Subordinated term debts comprise Redeemable Subordinated Rated Quoted Debentures of LKR 10 billion, having maturity periods ranging from 5 to 12 years, and subordinated institutional debt, which also contributes to the working capital requirements of the Bank. These subordinated debts qualify for Tier II capital of the Bank, and provide ample capital buffer for a sustainable business in the long-term.
The Group has long benefited from a strong bedrock of capital which has provided much stimulus in achieving solid business growth and resilience. The Tier I capital base of the Bank was LKR 19,888 million (2013 - LKR 18,350 million), while the Tier I capital ratio was 10.09% (2013 - 12.05%). The total (Tier I & Tier II) capital base of the Bank was LKR 28,932 million as at 31 December 2014 (2013: LKR 27,220 million). The total capital adequacy ratio (Tier I & Tier II) of the Bank, as at 31 December 2014 was 14.68% (2013: 17.87%).
At a Group level as at 31 December 2014, the core capital base and the total capital base were LKR 26,952 million (2013 - LKR 24,736 million) and LKR 35,267 million (2013 - LKR 34,343 million) respectively, while the core capital ratio (Tier I) and the total capital ratio (Tier I and Tier II) were 12.92% (2013 - 15.15%) and 17.55% (2013 - 21.04%) respectively.
Capital adequacy is discussed in detail under Financial Reports section.
The Bank’s statutory Liquid Assets Ratio for the Domestic Banking Unit and the Foreign Currency Banking Unit were 23.85% and 25.18% respectively as at 31 December 2014, which are well above the statutory minimum ratio of 20%. Deposit mobilization efforts and the strong credit growth experienced by the Bank have resulted in an effective mix of the assets and liabilities of the Bank, while maintaining adequate liquid funds.
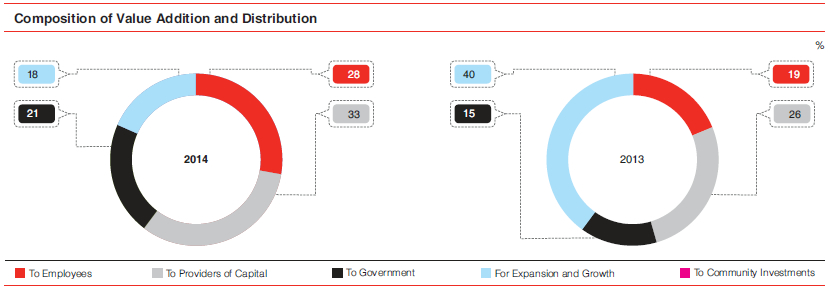
The Bank aims to create sustainable financial value over time. The value so created is distributed to stakeholders, while a portion is retained in the business for growth and contingencies. A five-year analysis of the Bank’s value addition and distribution is given below.
| For the year ended 31 December |
2014 LKR million |
2013 LKR million |
2012 LKR million |
2011 LKR million |
2010 LKR million |
| Value Added | |||||
| Income from banking services | 24,518 | 23,556 | 19,448 | 13,306 | 11,296 |
| Cost of services | (14,048) | (15,858) | (13,038) | (8,282) | (7,003) |
| Value added by banking services | 10,470 | 7,698 | 6,410 | 5,023 | 4,292 |
| Non banking income | 444 | 6,100 | 754 | 228 | 424 |
| Loan losses and provisions/impairments | (566) | (1,238) | (106) | (68) | 172 |
| Total value added | 10,348 | 12,560 | 7,058 | 5,184 | 4,888 |
| Distribution of Value Added | |||||
| To employees | |||||
| Salaries and other benefits | 2,873 | 2,389 | 2,173 | 1,838 | 1,326 |
| To providers of capital | |||||
| Dividend to shareholders | 1,978 | 3,222 | 657 | 880 | 983 |
| Interest to debenture holders | 1,378 | 95 | – | – | – |
| Total to providers of capital | 3,356 | 3,317 | 657 | 880 | 983 |
| To Government | |||||
| Income tax | 1,213 | 854 | 1,023 | 792 | 937 |
| Financial Services VAT | 882 | 911 | 622 | 505 | 805 |
| Nation Building Tax | 147 | – | – | – | – |
| Corporate Insurance Levy | (26) | 77 | – | – | – |
| Total to government | 2,216 | 1,842 | 1,645 | 1,297 | 1,742 |
| For expansion and growth | |||||
| Retained profit | 1,440 | 4,501 | 2,267 | 951 | 546 |
| Depreciation/amortisation | 323 | 302 | 265 | 227 | 191 |
| Deferred taxation | 127 | 194 | 38 | (17) | 83 |
| Total for expansion and growth | 1,890 | 4,997 | 2,570 | 1,160 | 820 |
| To community investments | |||||
| Donations | 13 | 14 | 13 | 9 | 18 |
| Total to community | 13 | 14 | 13 | 9 | 18 |
| Total distributed | 10,348 | 12,560 | 7,058 | 5,184 | 4,888 |
Economic Value Added (EVA) is an estimate of the Bank's 'economic' profit, as distinct from 'financial' profit. It is the value created in excess of the required return of the Bank’s investors, who comprise shareholders and debt holders. Given the importance the Bank places on creating superior shareholder value, the Bank's EVA computation is given below for the past five accounting periods.
| For the year ended 31 December |
2014 LKR million |
2013* LKR million |
2012 LKR million |
2011 LKR million |
2010 LKR million |
| Invested equity | |||||
| Shareholders’ funds | 22,238,192 | 19,620,478 | 14,942,400 | 12,675,139 | 11,606,990 |
| Add: Cumulative loan loss provision/ provision for impairment | 5,120,877 | 4,378,973 | 2,971,622 | 3,029,397 | 1,869,996 |
| Total | 27,359,069 | 23,999,451 | 17,914,022 | 15,704,536 | 13,476,986 |
| Earnings | |||||
| Profit after tax and dividend on preference shares | 3,418,062 | 7,723,235 | 2,923,957 | 1,830,818 | 1,529,376 |
| Add: Impairment provisions and other losses | 566,003 | 1,238,202 | 106,112 | 67,789 | (171,541) |
| Less: Loan losses written off | (63,869) | (76,345) | (66,769) | (6,031) | (206) |
| Total | 3,920,196 | 8,885,093 | 2,963,300 | 1,892,576 | 1,357,629 |
| Cost of equity (Based on 12 months weighted average T-bill rate plus 2% for risk premium) | 10.24% | 12.63% | 14.02% | 9.50% | 10.59% |
| Cost of average equity | 2,629,556 | 2,646,836 | 2,356,661 | 1,386,122 | 1,406,704 |
| Economic value added | 1,290,641 | 6,238,257 | 606,639 | 506,454 | (49,075) |
* The one-off equity income of LKR 6,031 million in 2013 is included.
The discussion thus far looked at the overall performance of Bank and the Group as a whole in deriving value. Given below is a more detailed review of the financial performance of the Bank’s principal lines of business - both core banking (Corporate, Retail, SME and Treasury) and the financial performance of the Group companies in the context of financial capital formation.
The Bank’s corporate banking business focuses on two areas, namely, Commercial Banking and Project & Infrastructure Financing (PIF). The commercial banking business has grown at a rapid pace and has become a significant provider of working capital for large and middle market businesses in the country. On the other hand, PIF, with its broad experience in all industry segments spanning a period exceeding three decades, finances large scale, long term projects. These two business units together effectively address the short and long term needs of the large and middle market customers across the country.
The Commercial Banking Unit is equipped with a range of traditional as well as innovative products to suit the varying needs of the market. They include import and export related products, guarantees, overdrafts, short term loans and treasury products. Coupled with seamless processes and a professional relationship management team, the business caters to the growth of existing as well as new customers.
| Commercial Banking KPIs | 2014 | 2013 | Growth in 2014 |
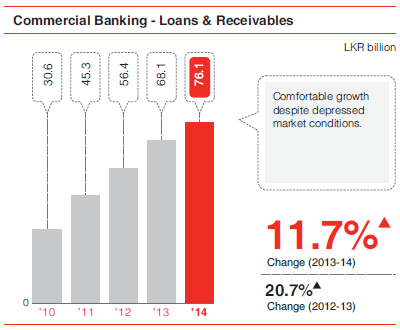
| Loans and receivables (LKR million) | 76,128 | 67,711 | 12% |
| Customer deposits (LKR million) | 29,356 | 26,234 | 12% |
| Banking revenue (LKR million) | 3,370 | 3,305 | 2% |
| NPL ratio | 0.8% | 1.8% |
The low interest regime that prevailed during the year together with limited credit growth and excess liquidity in the market compelled the Bank to focus on volume growth in the midst of rapidly reducing interest margins. The commercial banking asset portfolio grew by 12% during 2014 (2013: 20%), while the liability base grew by 12% (2013: 20%), with the CASA ratio maintained at 35%. The Unit’s revenue grew by 2% in 2014 (2013: 11%).
In line with national growth strategies, the Bank's commercial banking lending covered several projects in sectors such as construction, agriculture (including tea, paddy and related crops), chemicals, pharmaceuticals and tourism during the year. Going beyond the traditional large and medium sectors the Bank also introduced Distributor Financing and Supplier Financing to the Bank’s product range during the year. This initiative extends our commercial banking reach indirectly to the rural sector through our branch network by facilitating financial solutions down the entire value chain.
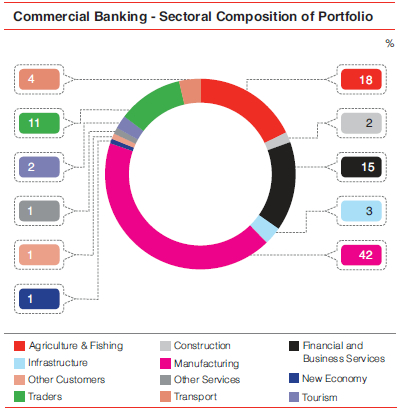
The pie chart depicts the commercial banking loans & receivables portfolio across the various sectors of the economy during the year.
The overall global economic and political conditions, particularly in the Middle Eastern and former Soviet bloc countries, had a negative impact on the export sector resulting in delays in collections. The local economy was also affected by extended credit, leading to stretched working capital cycles.
Despite these adverse conditions, our commercial banking loan portfolio has always maintained better than industry Non-Performing Loan (NPL) ratios due to excellent credit origination methods and proactive credit administrative procedures that identify warning signals well in advance. The NPL ratio of the Bank’s commercial banking portfolio has been below 2% for over five years, and it stood at 0.8% by end 2014.
The adaption of Sri Lanka Accounting Standard 39: ‘Financial Instruments Recognition and Measurement’ which regulates the impairment of loans and advances has further enabled the Bank to identify the early warning signals along many angles while maintaining a proactive approach in addressing possible delays and non-repayment of loans.
Along with the financial services sector of the country we too will adjust our business model to adapt to the changes that take place in the micro as well as the macro environment. While exploiting new business opportunities, the focus will be on the exports, construction and agriculture sectors.
Further, in an environment of reducing interest rates and thinning net interest margins, a concentrated effort would be required to boost fee-based income.
Certified by ISO 9001: 2008 for Corporate Banking and Trade Finance Departments, implementation of the 5-S methodology, a state of the art electronic banking system and an expanded correspondent banking network, the Bank’s commercial banking business looks forward to 2015 with optimism.
The strategic plan of the Bank set the platform for the Project & Infrastructure Financing (PIF) focus. With a rich legacy of being one of the premier development financiers in the country for over three decades, PIF saw profitable and aggressive asset growth during the year, particularly in the construction, power & energy and leisure sectors. We also identified business opportunities, such as offshore project financing, which has opened new markets that will be explored further.
The product and service portfolio of PIF is structured to facilitate the long term funding requirements of clients across the diverse business requirements of different industries. The main products are medium term and long term loans, project loans and securitization of future receivables. In addition, PIF selectively invests in debentures and preference shares to support the growth needs of customers.
Although PIF does not offer advisory services as a separate product/service, the division’s clients are benefited by the technical expertise and advisory services provided by the vastly experienced personnel of PIF.
| PIF KPIs | 2014 | 2013 | Growth in 2014 |
| Loans, receivables and investments (LKR million) | 34,023 | 21,742 | 56% |
| Banking revenue (LKR million) | 838 | 652 | 29% |
| NPL ratio | 1.7% | 0.8% |
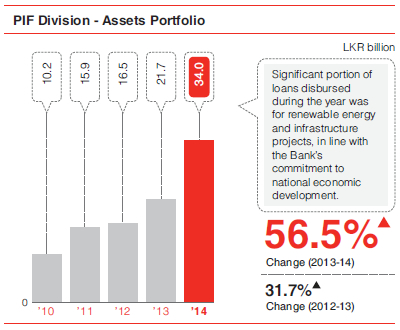
The period under review was challenging as the excess liquidity in the market kept lending rates under pressure. In addition, lower than anticipated private sector credit growth fuelled stiff competition among the industry players. Despite this scenario, PIF recorded an impressive 56% growth in assets in 2014, further building on the healthy 32% growth achieved in 2013.
Although strict monitoring and recovery practices ensured that the NPL ratio was maintained below 1% throughout most of the year, two large facilities which were classified during the last quarter of 2014 saw the PIF NPL ratio rise to 1.7% as at year end.
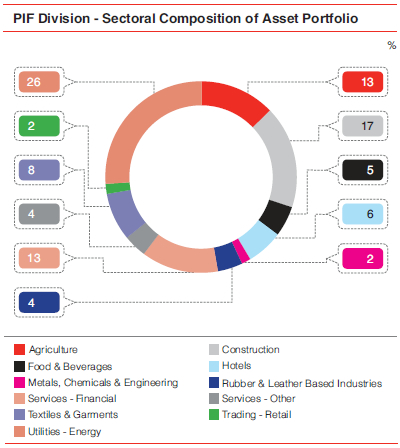
Term loans and securitizations of future receivables accounted for about 80% and 14% respectively of the total PIF asset portfolio by end of 2014, while investments in debentures accounted for the balance 6%.
| Component | Year | ||||
| 2014 | 2013 | 2012 | 2011 | 2010 | |
| Loans and securitizations | 94% | 92% | 100% | 100% | 100% |
| Debentures and preference share investments | 6% | 8% | 0% | 0% | 0% |
In terms of industry sectors utilities, agriculture, construction and financial services topped the list and accounted for 26%, 13%, 17% and 13% respectively of the PIF asset portfolio.
Banking revenue of PIF increased by a satisfactory 29% during the year to reach LKR 838 million (2013: LKR 652 million), although not commensurate with the asset growth of 56% due to the squeeze on margins noted earlier.
PIF facilities exceeding LKR 38.6 billion approved during the year partly contributed to the asset growth seen in 2014, while it will also fuel asset growth in the next few years as disbursements take place. This includes a novel project in the manufacturing industry and a landmark mixed development project which is considered to be the country's largest ever private sector development project. In the energy sector, realizing the value of renewable energy both in terms of the global environmental impact as well as the nation’s expenditure on fossil fuel, the Bank took a lead role in financing a 20 MW wind power project in the Northern Province. In addition, we financed one of the first few commercial scale biomass projects in the country, a 6 MW plant that became operational in May 2014, making the Bank a financier of green energy generation in true spirit.
Continuing from the previous year’s foray into the Bangladesh market, financial closure for a large scale PIF facility for a new energy project in Bangladesh was completed during the year. In addition, further steps were taken towards establishing funding opportunities in overseas ventures, with steady headway being made to capitalize on business prospects in the energy sector in the African region.

Wind Power Project site of Joule Power (Pvt) Ltd. - one of the first wind power projects set up in Pullopalai, Killinochchi was funded by the Bank
The future offers unique opportunities as well as challenges considering the anticipated continuation of the growth momentum. Further large scale funding opportunities are envisaged in infrastructure development, leisure and property development projects and the Bank will selectively focus on furthering its reach into regional markets to leverage its expertise in project and infrastructure financing. In an environment where the net interest margins are stressed further, the Bank will seek sustainable growth through the promotion of financial inclusion by supporting projects in less developed areas, while reaping synergies by cross selling products and services between different business units as well as Group companies.
The Bank ventured into retail banking with the acquisition of the business of ABN Amro Bank Colombo in 2001. From this modest beginning the Bank has made vast strides in providing retail banking services to all segments of customers in the country, while seamlessly complementing other products and services offered by the Bank and the Group. Given its appeal to a broader customer base, the Retail Banking Unit often serves as the 'face' of the Bank, taking forward the NDB brand name to all parts of Sri Lanka.
| Retail Banking KPIs | 2014 | 2013 | Growth in 2014 |
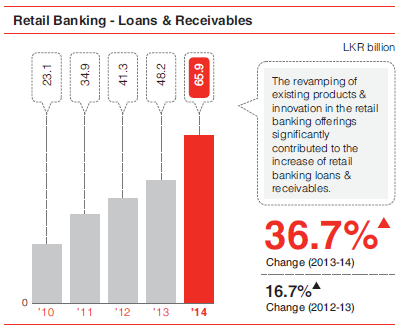
| Loans and receivables (LKR million) | 44,906 | 32,630 | 38% |
| Customer deposits (LKR million) | 109,278 | 95,450 | 14% |
| Banking revenue (LKR million) | 2,927 | 2,989 | -2% |
| NPL ratio | 2.3% | 3.0% |
Retail banking total assets grew by 38% to LKR 44,906 million during the year, with a corresponding 14% growth in deposits that reached LKR 109,278 million by 31 December 2014.
The year saw a host of retail banking asset products and deposit products being revamped, re-launched and reinvented during the year, which directly contributed towards the growth of the asset base. More details on these new product developments are found under Customer Capital section.
The five year growth in the loans and receivables of the Retail Banking Unit is depicted below. The asset base has grown robustly and consistently over the years.
Retail banking market penetration and innovation will take precedence over mere geographic expansion in the years to come. This would also mean smarter application of digital technology that opens up numerous channels with better customer appeal, while not confining oneself to traditional expansion through brick and mortar branches.
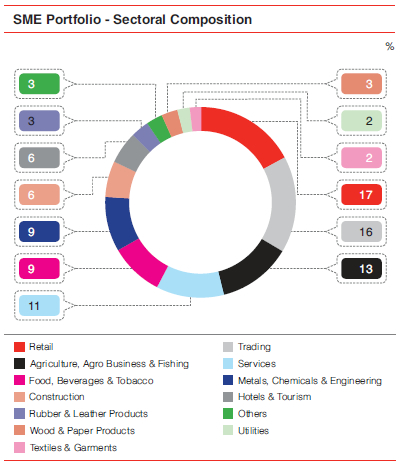
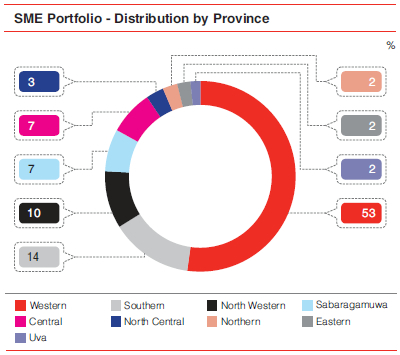
The year under review saw the resurgence of the Small and Medium Enterprise (SME) sector in line with the significant emphasis placed by the government towards the revival of the backward economies. Sustaining the post-war growth, the Bank too prioritized its emphasis on the sector which resulted in a growth of 35% of the SME portfolio during the year in the backdrop of a severely competitive environment and moderate credit growth.
The USD 200 million funding line obtained from IFC during the year enabled the Bank to offer affordable long term financing for the SME sector. In addition, the Bank continued to extend concessionary funding through other financial institutions and its own banking network by playing the role of an apex organization to support the much needed capital of the micro, small and medium enterprises in the country. The Bank continued its participation in refinancing schemes operated by the Central Bank of Sri Lanka and other lending agencies. The resources for the apex operations were mobilized from multi-lateral and bi-lateral international organizations with the initiation and active support received from the Government of Sri Lanka.
As in many other countries, SMEs in Sri Lanka account for a significant proportion of employment creation, and serve as the backbone of the country’s rural as well as urban economy. The Bank’s years of active engagement with the SME sector has borne fruit through strong customer loyalty and geographic reach. Going forward, emphasis will be placed in exploiting new avenues and value propositions outside the generic SME financing with more concentration on product bundling, delivery mechanisms and value chain financing.
Financial inclusion has been an integral component of the Bank’s purpose of doing business since its inception. The Bank’s micro-finance strategy adopts a two-pronged approach in targeting unserved and underserved economies of the country. One approach focuses on empowerment and capacity building of such communities, whilst the other predominantly focuses on livelihood development financing. These are discussed further under Customer Capital section.
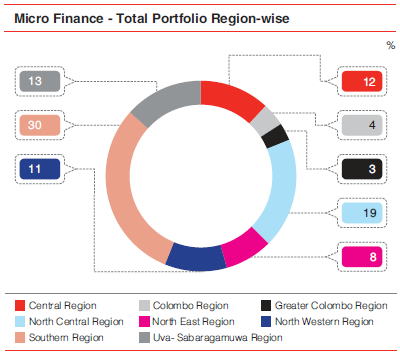
The micro finance strategy for 2015 will focus primarily on empowerment and livelihood development, which will lead to financial literacy and inclusion to a great extent. The Bank will replicate the success experienced in establishing loyalty groups at grass root level, and take it forward to uplift small scale industrialists to the next level of entrepreneurship. Heavy thrust will be placed on end to end financing of the supply chain, with emphasis on collaborations with top corporates with supplier arrangements at the micro level.
| SME & Micro Financing KPIs | 2014 | 2013 | Growth in 2014 |
| Loans and receivables (LKR million) | 21,078 | 15,600 | 35% |
| Banking revenue (LKR million) | 1,284 | 1,216 | 5.6% |
| NPL ratio | 4.8% | 4.9% |
As a significant market maker amongst the local commercial banks, the Bank's Treasury Unit is a specialized service provider catering to corporate, institutional and individual investors. Treasury operations comprise of two aspects, one which covers foreign exchange, money market and Asset and Liability Management (ALM) operations to generate profit, whilst the other taking on the responsibility for interest rate risk, foreign exchange risk and liquidity risk of the Bank.
The stable exchange rate regime adopted by the Central Bank of Sri Lanka provided the backdrop for the provision of FX products and advisory services. Spot and forward contracts, swaps, options and dual currency deposits were the main product streams through which the FX desk provided its expertise.
Managing the Bank’s Statement of Financial Position within the prescribed risk and return parameters saw sound results in a declining yield curve environment. Funding an aggressive growth of the Statement of Financial Position by utilizing an optimal mix of resources through capital planning, credit lines, demand deposits and money market operations was important in this respect. Government debt trading presented the best opportunity during the year due to the declining yield curve, while repurchase and reverse repurchase contracts, corporate debt securities, money markets and tailor made structured deposits comprised the complete arsenal used for ALM purposes.
The arbitrage opportunities presented were tapped fully to maximize revenue, while the spot, forward, swap and options contracts were utilized to manage proprietary trading positions and to cover client transactions which paid rich dividends. Increased customer volumes contributed significantly to the bottom line of the FX desk that saw revenue increase by 5.7% to LKR 1,008 million in 2014 (2013: LKR 953 million).
Strategic accumulation of government securities in 2013 provided the impetus for the success of the ALM Unit in 2014, with securities trading yielding gains of LKR 569 million. Further, the strategic positioning of liquidity and interest rate gaps provided an additional net interest income of LKR 998 million.
A gradual acceleration of credit demand in the last quarter of 2014 coupled with anticipated increase in consumer spending is expected to exert pressure on the consumer price index, and in turn on the yield curve. Mitigating factors to be considered are the global decline in oil prices which have a significant impact on Sri Lanka’s oil dependent economy. The expectations are that an upward shift in the yield curve could be witnessed toward the third and fourth quarters of 2015. Balance sheet planning and ALM will receive close attention in the light of medium term forecasts. The exchange rate is expected to remain stable and stay within the 5% p.a. depreciation witnessed in the past few years.
Planning and execution of an optimal funding strategy with due focus on surplus liquidity management until disbursement is of paramount importance. In an era of financial consolidation, Treasury aims to maximize Group synergies in order to contribute an even greater share of revenue in the coming years.
| Treasury KPIs (LKR million) | 2010 | 2011 | 2012 | 2013 | 2014 |
| FX Sales | 232.5 | 315.9 | 274.3 | 304.3 | 318.3 |
| FX Trading | 302.1 | 443.8 | 702.1 | 648.7 | 690.3 |
| FX Total | 534.6 | 759.7 | 976.4 | 953.0 | 1,008.6 |
| Net Interest Income: | |||||
| - G Sec NII | 554.8 | 338.6 | 271.1 | – | – |
| - G Sec Trading | 145.0 | (43.8) | 33.8 | 213.0 | 569.0 |
| - ALM | – | – | – | 222.0 | 998.0 |
Given below is a discussion on the financial performance and the future prospects of each of the Group companies which complements the Bank's core banking operations, enabling the Group to provide a wide range of financial services and products across a varied cross section of customers.
NDB Capital Holdings PLC (NCAP), formerly known as Capital Development and Investment Company PLC (CDIC), was formed in 1983 as a venture capital company. CDIC was subsequently listed on the Main Board of the Colombo Stock Exchange in 1996. Following a restructuring within the Group in mid-2012, CDIC was transformed into a full service investment bank and rebranded as NDB Capital Holdings PLC, which has since been de-listed with effect from 26 January 2015.
NCAP and its subsidiaries (collectively referred to as the Investment Banking Cluster) are uniquely positioned to facilitate the economic development and growth of the capital market of Sri Lanka.
NCAP’s fee-based operations are carried out through its subsidiaries, NDB Investment Bank Ltd. (NDBIB), NDB Wealth Management Ltd. (NWM), NDB Securities (Pvt) Ltd. (NDBS) and NDB Zephyr Partners Ltd. (NDBZ). The fund based activities of NCAP are carried out directly by the company itself, which include investments in private equity, listed equities, fixed income securities and proprietary trading.
NDBIB is the market leader in both debt and equity capital markets and corporate advisory services. NCAP provides wealth management services to clients through NWM, the largest private sector wealth management company in Sri Lanka. NCAP’s stock broking operations are through NDBS, a full-member firm of the Colombo Stock Exchange which offers high-end research and brokerage services to both local and foreign investors in the Colombo Stock Exchange. NCAP completed its missing link in the product portfolio when it floated NDBZ in December 2014, a 60% owned subsidiary based in Mauritius that provides private equity management services.
The Investment Banking Cluster reported excellent results in 2014. NCAP launched Sri Lanka’s first largest private equity fund during the year with its first closing amounting to USD 42.5 million in partnership with U.S. based Zephyr Management LP, one of the leading emerging market private equity fund managers. Several leading international development finance institutions such as International Finance Corporation (IFC), Deutsche Investitions-und Entwicklungsgesellschaft mbH (DEG) and Nederlandse Financierings- Maatschappij Voor Ontwikkelingslanden N.V. (FMO) participated in this pioneering initiative. In parallel, a new 60%-owned subsidiary of NCAP was floated in Mauritius as a joint venture private equity management company in partnership with Zephyr Management LP, which brings with it years of expertise in managing private equity investments in emerging markets. NCAP has committed USD 12 million to the said private equity fund which would be called over the next five years.
NCAP made a successful structured equity investment in the listed space during the year. NCAP together with ACL Cables PLC and Trydan Partners (Pvt) Limited acquired a 75% stake in Resus Energy PLC (formerly known as Hemas Power PLC) in December 2014. Trydan Partners (Pvt) Limited is a special purpose vehicle backed by the management team of Resus Energy PLC. This investment is expected to yield attractive returns with planned capital restructuring of Resus Energy PLC and implementation of new power projects that are in the pipeline. NCAP is presently in the process of creating a portfolio of structured equity investments especially through its commitment to the private equity fund to provide long term sustainable returns to shareholders.
The Investment Banking Cluster was recognized internationally by bagging a total of 21 global awards including that from Euromoney. In fact, the Group achieved the rare feat of being the only Asian investment bank to be recognized as the ‘Best Investment Bank’ in two countries simultaneously, namely Sri Lanka and Bangladesh, thus firmly establishing the Group as a regional investment banking player of stature.
As a knowledge and people driven industry, the Investment Banking Cluster places special emphasis on developing its human capital. Our staff underwent leadership development training as well as technical training on relevant specialities, both in Sri Lanka and overseas. This enabled us to produce a pool of future leaders to drive business growth.
During the year, NCAP awarded scholarships to ten deserving undergraduate students as a part of our Corporate Social Responsibility. These students were selected from the Medical and Law faculties of the University of Colombo, Management faculty of the University of Sri Jayewardenepura and Engineering faculty of the University of Moratuwa. In addition to the financial assistance, NCAP plans to guide and nurture the recipients of the scholarships by way of career guidance and counselling to prepare them for the future job market.
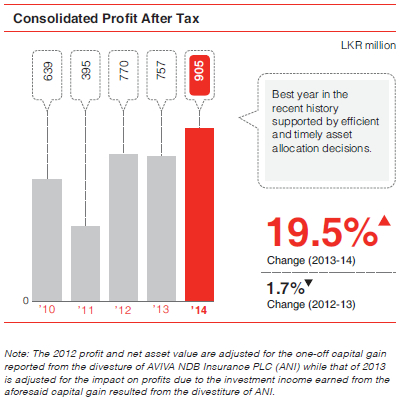
The consolidated Profit Attributable to Shareholders (PAS) of the capital market cluster for the year was LKR 905 million, a 20% increase over 2013 (after adjusting for LKR 175 million impact on profit due to the investment income earned from the capital gain which resulted from the divesture of Aviva NDB Insurance PLC).
| KPIs of NCAP | 2014 | 2013 |
| Investments (LKR million) | 1,169 | 1,551 |
| Profit after tax (LKR million) | 905 | 757 |
| Return on equity | 15% | 14% |
| Operating profit margin | 63% | 66% |
| Net profit margin | 64% | 59% |
The Investment Banking Cluster will focus on consolidating and building on its leadership position, particularly by seeking opportunities to optimize synergies across the Cluster and the Bank to create competitive products and services in the market. Further, NCAP will work on creating a diversified investment portfolio that would ensure steady and attractive returns to shareholders during the next three to four years.
NDBIB provides fee-based corporate advisory services and performs capital raising activities for clients including large corporates, financial institutions and high net worth individuals.
As the market leader, NDBIB’s core strength lies within its people. A stringent recruitment process complemented by a strong focus on on-the-job training and continuous skills development has ensured that NDBIB possesses the best pool of talent within the industry.
The plethora of debenture issues fuelled by tax concessions in the preceding year, where NDBIB spearheaded the market, remained somewhat subdued. The excess liquidity in the market, availability of low cost short term funding and speculation surrounding the low interest rate regime dampened the appetite for long term debt instruments. In this scenario, NDBIB secured debt financing of over LKR 21 billion mainly through a mix of debentures, securitizations, long term facilities and commercial paper.
Noteworthy transactions include the following.
Despite the growth in returns witnessed by the market, the demand for fresh equity capital remained low as investors’ desire for new projects failed to grow in similar proportions, possibly on the expectation of more resilient market conditions in the forthcoming year.
NDBIB’s continued support towards Central Bank of Sri Lanka’s Financial Sector Consolidation Plan was evident in the several assignments carried out by the Corporate Advisory Division during the year. This included mergers and acquisitions amongst finance sector companies listed on the CSE, rights issues and advising clients on mandatory offers. Our involvement in this multi-phased process - from identifying acquisition targets to the final amalgamation - has given NDBIB significant insight and opportunity to play a major role as a total solutions provider for its clients.
Our contribution towards the Sri Lankan capital market has not gone unnoticed, with NDBIB winning the ‘Best Investment Bank in Sri Lanka’ award for the third consecutive year at the Awards for Excellence 2014 by Euromoney, the world’s premier financial markets magazine. During the year NDBIB was also honoured with several more awards, as detailed on Recognition section.
| KPIs of NDBIB | 2014 | 2013 |
| Funds raised LKR billion | 24.52 | 42.20 |
| Profit after tax LKR million | 60.33 | 179.11 |
| Operating profit margin | 35.95% | 62.28% |
| Net profit margin | 35.37% | 48.89% |
| Return on equity after tax | 11.63% | 42.67% |
The Bank successfully managed to raise LKR 24.5 billion despite subdued market conditions due to excess liquidity in the market, availability of low cost short-term funding and speculation surrounding the low interest rate regime.
The year saw continued foreign participation coupled with improved corporate earnings and a low interest rate environment that pushed the equity market to heights unseen in the recent past. Such factors have reignited investor confidence in Sri Lanka, and is expected to continue in the coming year. Having secured mandates for some innovative deals and a promising pipeline of both debt and equity deals, NDBIB will seek to build on its true potential and enjoy a fruitful year in 2015.
NWM offers three distinct services, namely, Discretionary Portfolio Management which is focused on large institutions such as insurance companies, provident funds and corporates; Private Wealth Management catering to high net worth individuals; and several risk rated Mutual Funds to meet the wealth planning needs of the retail mass market, with the last mentioned fulfilling the vision articulated by the Securities & Exchange Commission of Sri Lanka of “taking the capital market to the masses”.
The use of technology to deliver superior investment research and manage portfolios of institutional clients, together with an approach which blends individual decision making and creative thinking with teamwork while adhering to high standards of compliance have contributed to superior performance and client satisfaction.
While the year 2014 was largely a period of consolidation, NWM increased assets under its management, a key parameter for measurement of success in wealth management, by 34% to a value of LKR 86.8 billion during the year. In turn, the increase in profit after tax of 99% to LKR 172.1 million and a return on equity of 39% serve to complement an excellent year for NWM.
| KPIs of NWM | 2014 | 2013 | Growth in 2014 |
| Total assets under management, LKR billion | 86.8 | 64.8 | 34% |
| Profit after tax, LKR million | 172.1 | 86.6 | 99% |
| Return on equity | 39% | 27% | 44% |
Ending the year on a high note, NWM emerged as a leader in the country's wealth management business in 2014, duly recognized through the 'Best Investment Manager' award from World Finance and 'The Best Asset Management Company' award from Global Banking and Finance Review.
We believe the future of personal financial services in Sri Lanka will be defined by the convergence of capital markets and retail banking. NWM is well positioned to be the trend setter in this process.
The market sentiment improved in the year 2014 with the All Share Price Index (ASPI) crossing a two-year high of 7,500 with an average daily turnover of LKR 1.3 billion. The growth in corporate performance supported by the continued decline in the interest rates resulted in the market gaining momentum during the second half of the year. Retail activity saw an improvement in comparison to 2013, while foreign buying topped an all-time high of LKR 105 billion. The market capitalization crossed LKR 3 trillion.
With continued integration within the Group, NDBS increased its reach through the Bank’s branch network by penetrating into regions and communities that were hitherto untapped. Awareness creation and investor relations programmes were conducted in several parts of the country, duly supported by our dedicated investment advisors specialized in multidisciplinary fields. The year saw our diverse client base - ranging from institutional and high net worth to retail investors - increasing by 5.8% to 51,822 accounts.
Research plays a vital role in the investment recommendations made by our advisory team. Our research coverage was expanded during the year with more frequent trilingual publications. In terms of performance, returns on our research recommendations have continued to outperform the benchmark ASPI for the past three years and has been amongst the best as evident by the rankings given by Bloomberg.
| KPIs of NDBS | 2014 | 2013 | Growth in 2014 |
| Profit after tax (LKR million) | 26 | 7 | 271% |
| Net profit margin | 15.6% | 6.5% | 140% |
| Return on equity | 8.4% | 2.4% | 258% |
NDBS raised client servicing levels through enhanced IT applications. The NDBS website was revamped with responsive design and technological advances such as automated document filing and easy access to research material. The Internet trading platform was upgraded for greater customer convenience, while NDBS became the first and only stockbroking company to offer an SMS portal with instant updates on account movements.
With the expected economic growth rates and the continuation of a low interest rate regime in the coming years, the capital market is poised to grow and play a bigger role. Our primary focus during 2015 will be to expand the high net worth and the foreign investor segments, while growing the retail segment through existing networks. The application of technology will be further enhanced in line with improvements in the industry such as a system of delivery versus payment as well as an enhanced risk management framework through the central counterparty system.
NDB Capital Ltd. (NDB Capital) is the investment banking arm of the Group in Bangladesh. With the strength of the Group’s strong knowledge and placement capabilities in investment banking, NDB Capital is offering innovative products to the capital market of Bangladesh.
NDB Capital has been successful in establishing a unique brand identity by carrying out a number of landmark investment banking transactions in the capital market of Bangladesh. The product range offered includes the following.
| Fund Raising | Corporate Advisory | Portfolio Management | ||
|
|
|
The focus during the year was on the cross border business and investments between Sri Lanka and Bangladesh. NDB Capital successfully raised USD 50 million for a dual fuel power plant in Bangladesh promoted by a leading Sri Lankan energy company. This transaction clearly showed the Group synergies where NDB Capital and NDBIB acted as joint arrangers, while the Bank participated in the deal with financing. In addition, NDB Capital was instrumental in facilitating the entry of a leading Sri Lankan finance company and a construction company into Bangladesh. NDB Capital arranged a number of meetings with prospective joint venture partners, regulators and other industry stakeholders for the two companies. In addition, NDB Capital is presently working on a mandate to raise debt finance from Sri Lankan banks for a leading footwear manufacturer in Bangladesh with a guarantee from a local bank.
These efforts won recognition in no small measure. NDB Capital was picked as ‘The Best Investment Bank in Bangladesh 2014’ by Euromoney, World Finance & Global Banking and Finance Review magazines.
Managing diversified and innovative transactions has created a unique brand image for NDB Capital Ltd. in the Bangladesh capital market. With this competitive advantage, the team is chasing ambitious targets for mandates in sectors such as energy, steel, construction and real estate through targeted products and services. NDB Capital views the future with confidence and the expectation of even better performance in the years to come.
NDB Zephyr Partners Ltd. (NDBZ) is jointly owned by NDB Capital Holdings PLC (60%) and Zephyr Management LP (40%), a New York-based global emerging markets investment firm. Set up in 2014, NDBZ is the Fund Manager of the Emerald Sri Lanka Fund which will make private equity investments in small and mid-sized businesses seeking expansion capital in Sri Lanka.
NDBZ believes that Sri Lanka provides excellent conditions for growth by small and mid-sized companies. These conditions include political stability, a rapidly growing economy and an educated labour force. Sri Lankan SMEs currently have limited equity raising options until an IPO. However, many SMEs are not ready for an IPO, due to their small size, lack of management depth and inadequate governance.
NDBZ will assist its portfolio companies in areas such as strategic planning, management development, improving financial management, corporate governance and operational efficiencies. The Fund Manager will also help the portfolio companies in accessing international markets and optimizing their capital structures. Exits will be generated via the IPO market or through trade sales to domestic or international buyers.
The investment team of NDBZ will draw on the capabilities and experience of the Fund Manager’s parent companies, NDB Capital and Zephyr Management LP. The investment team of the fund will benefit from NDB Capital’s deep understanding and experience in the Sri Lankan market. Zephyr Management will provide the Emerald investment team with expertise regarding the investment process, including deal evaluation, portfolio management and exits.
Development Holdings (Private) Ltd. (DHPL) is engaged in the business of renting out a 16-storied high rise commercial property in the heart of Colombo, popularly known as the NDB-EDB tower. The management of the property is jointly carried out by the Bank and the Sri Lanka Export Development Board (EDB).
Sri Lanka Export Development Board and several departments including the Navam Mawatha Branch of the Bank are housed in the NDB-EDB tower, along with many other renowned local and global institutions. The NDB-EDB Tower is a state of the art modern commercial property, with many facilities. It has a fully-fledged auditorium with seating capacity for 250 people, ample and convenient parking space, a cafeteria which can accommodate 200 people at a time and a balcony lobby area with a magnificent view of the Beira Lake.
DHPL will continue to provide a strategic location for its diversified tenants. The property is being upgraded and modified whenever possible to maintain its stature and prominence.
Institutional capital covers a broad spectrum of non-financial components that are, like financial capital, internal to the Bank and the Group. It is a collection of intangibles that includes aspects such as corporate culture and values, business ethics and integrity, brand value, organizational knowledge, systems, processes, intellectual property and so on.
The five core values of the Bank comprising integrity, care, passion, teamwork and service are incorporated into daily work, be it in dealing with colleagues, subordinates and supervisors or customers and potential customers of the Bank. These values are articulated through specific competencies which are internalized through recruitment, training, performance management and other human resources-related activities.
Sound business ethics and integrity are aspects that are well understood and reinforced in all our activities. As discussed in the Corporate Governance Report and elsewhere, several frameworks, codes and control mechanisms are in place which are reviewed from time to time and upgraded based on need. What is more, we have brought our business partners too into this circle through a Sustainable Supply Chain Management process that takes into account an assessment of suppliers in the context of environmental, labour and social factors. The Bank is proud of its unblemished record in this sphere.
Having transformed from a state-owned, credit line dependent, development financing institute to a privately-owned, commercial banking conglomerate offering a gamut of financial services under one roof, the Bank endeavours to financially empower individuals and communities, while continuing to strengthen the infrastructure development and production capabilities of the country - thus contributing to national economic development.
The current positioning of the NDB Bank brand therefore is rather distinct, where the Bank is positioned as a financial institution that extends and expands its widespread financial expertise to shape the lives of a diverse clientele that includes individuals, professionals, entrepreneurs as well as large scale corporates and projects. The Bank has thus successfully evolved into a household name and has been listed amongst the top 20 brands in Sri Lanka over the past 5 years. Within the banking and financial services industry, ‘NDB’ stands at the 8th position in terms of brand ranking with a brand value of LKR 5.6 billion and a rating of A+ (Brands Annual 2014 by Brand Finance).
During the year under review, we continued to establish and strengthen this brand positioning by engaging with its diverse clientele; conducting mass-scale retail product advertising for individuals, organizing workshops and training programmes for grass root level micro-industrialists and SME entrepreneurs and through events and sponsorships that aimed to strengthen relationships with large corporates and premium clients. The ‘De Lanerolle Brothers Live in Concert’, Toccata Musical Productions - UK, and NDB-RCGC Inter-school Golf Tournament were some of the key highlights of such strategic sponsorships. Further in 2014, the Bank continued to reinforce its brand presence online, while meaningfully engaging with the emerging segment of tech-savvy youth customers and prospects through its many social media platforms including Facebook, Twitter, Youtube and LinkedIn.
The Bank has developed several internal systems, processes and procedures over the years which are unique to the institution.
The Bank’s internally developed Environmental and Social Management System (ESMS) screens all projects to be financed against related laws, regulations and norms as well as inherent risks. It includes downstream aspects during project implementation. Our ESMS meets all relevant national regulatory standards, as well as those of international lending institutions.
Targeting the SME sector the Bank developed a Receivables Management System and a Purchase Order Management System, both of which were fully operationalized in 2013. This was part of a larger reorganization that brought all support functions - Central Processing, Trade Finance, Treasury Operations, Human Resources and Administration - under the umbrella of the Operations Department.
We concluded the revamping of our staff Performance Development System with the full involvement of employees during the year. The system was reengineered to cater to the rapid expansion of the Bank and its scope of operation and the consequential rise in the number of staff. The process is aimed at providing career progression to employees depending on abilities, commitment and performance. With a longer term focus on staff retention, the Bank regularly reviews its Equity Linked Compensation Plan with new criteria that also aims to draw in a larger section of employees.
The Bank is governed by a comprehensive Procurement Policy, towards achieving the twin strategic goals of cost optimization and operational excellence. This Procurement Policy is aimed at enhancing the transparency of the Bank’s procurement process, minimizing delays and obtaining financially the most advantageous and qualitatively the best goods and services to the Bank.
The Procurement Policy prescribes standards, specifications, rules, regulations and good governance in the procurement process, whilst providing fair, transparent, equal and maximum opportunity for eligible interested parties to participate in the Bank’s procurement process. The overall procurement process is driven by a CEO-appointed Procurement Committee that may also seek external consultant expertise whenever required. It is executed while maintaining the highest levels of ethics including confidentiality and the avoidance of corruption, abusive use of power and conflict of interest.
All procurements are done locally. A responsible supplier with shared values is not only a welcome member of our extended business family, but is also one that mitigates risks against our reputation and business continuity.
Outsourcing is often viewed as contracting out a business function performed in-house, to an external service provider for a fee. The Bank's Outsourcing Policy ensures an optimal balance between the quality of human resources engaged and costs for the same.
The Board Audit Committee-approved Outsourcing Policy is driven by an Outsourcing Committee. The Committee inter alia ensures that adequate risk mitigation controls are in place and all outsourcing activities comply with the Bank’s Outsourcing Policy and the Banking Act Direction No. 2 of 2012 issued by the Central Bank of Sri Lanka on outsourcing business operations of a Licensed Commercial Bank.
The Outsourcing Policy has been instrumental in yielding considerable cost savings to the Bank through specialized resources which carry the strategic advantage of being outsourced rather than being performed in-house.
The Bank’s core banking system, implemented in 2013, served to integrate multiple applications into one seamless platform. Its front to back office software platform powers the retail, corporate and universal banking operations of the Bank, running 24/7 and in real-time across all branches. This has greatly enhanced customer service as well as management information and report generation capabilities.
Combined with an open architecture and tooling this integration enables the Bank to shift its IT investment from maintenance to innovation. This was showcased by the introduction of a range of asset and liability products such as ‘Shilpa’, ‘Salary Max’ and ‘NDB Educator’ during the year. We also upgraded the core banking system and other interfaces to enable Islamic banking services that targets a growing market segment, developed in-house an e-Remittance System and upgraded the ATM switch for the launch of the NDB Good Life Credit Card and the NDB Travel Card.
The Bank established connectivity with the Lanka Clear Common Payment Switch, a national development initiative which will greatly support the proposed consolidation of the banking and financial services industry, allowing greater reach, service offering and convenience to customers through a common platform. In addition, it offers significant savings in foreign exchange to the country as every LankaPay ATM transaction is channelled through a domestic network.
The Bank opened its first digitized branch, 'NDB Connect', at the Kandy City Centre during the year. This landmark venture endorsed a new digital banking experience for customers which included interactive touch screens, laser key boards and the like.
As a strategy for IT procedural efficacy and value enhancements the Bank adopted VoIP technology to enhance communication services across the Bank’s network. This has enabled data integration, unified communication, collaboration and multi-party conferencing. Webinar is one such resulting product which is effectively used by the Bank for Investor Relations.
To enhance the Bank’s risk management capabilities, an automated credit scoring system was introduced for optimized lending. Further, two full scale disaster recovery simulations were successfully conducted during the year, in line with the Bank’s business continuity plan.
The newly set up Transactional and Institutional Banking Unit became fully operational during the year. Its scope include cash management, corporate electronic banking, correspondent banking, worker remittances, trade & treasury marketing and managing financial institution relationships.
Cash management focuses on providing solutions to high end corporate clients on their complex day-to-day payments and collections requirements, in addition to supporting their capital market activities. As a result, in 2014 we have successfully served as bankers for several debenture and rights issues of corporate clients, and plan to widen our scope of work in 2015 to include facilitating EPF and ETF payments and processing of dividends.
The Bank’s electronic banking platform, ‘e-Window’, was upgraded in 2014 to incorporate many customer-centric features. This also helped in encouraging the SME sector to make use of such channel to enhance their banking experience. An overall outcome was a 20% increase in the Bank's e-Window System, which is expected to grow further in the years to come as part of our long-term strategy.
Cash management also worked on developing new customer segments which are strategically important to the country. In supporting this initiative, the Bank will consider providing specialized counters and language expertise to service these client segments.
A strong correspondent banking franchise allows the Bank to prudently access international markets and maintain adequate levels of relationships and limits for domestic and overseas banking transactions to support the business units. During 2014 negotiations with specific correspondents produced new links for potential business from bid bonds, performance bonds, advance payment bonds etc., including making inroads into the Chinese market through leading Chinese banks.
The Bank’s e-Remittance system was upgraded in 2014 to facilitate instant processing of inward remittances to ensure that funds are credited to beneficiaries within minutes of origination of transactions via an automated straight through process. The system improvements will continue in 2015 as part of our efforts to further enhance the quality of our services and attract more remittance throughput via the Bank.
The Bank’s legal services have not been informed of or have pursued any actions where any fines were imposed on the Bank in relation to non-compliance with laws & regulations relating to corruption, anti-competitive behaviour, anti-trust, monopoly practices or laws & regulations concerning the provision and use of products and services and related matters during the year. There were no fines charged or non-monetary sanctions for non-compliance with laws & regulations.