Pushing the Pace in
a Resurgent Sri Lanka
a Resurgent Sri Lanka
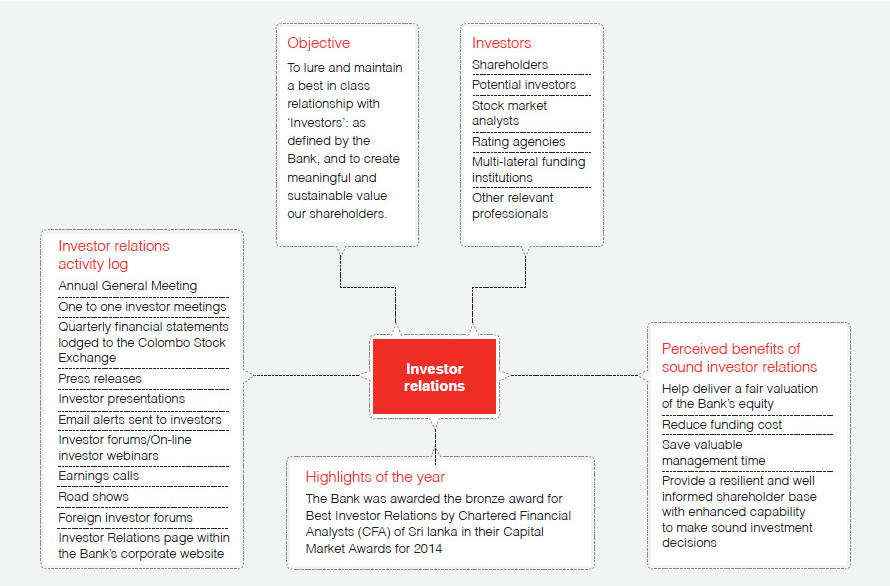
The Bank recognizes investors as one of the prime most stakeholders in its success journey. The long-standing trust, loyalty and confidence that our valued shareholders have placed on us has been an immense strength to us. The Bank takes conscious efforts to actively engage our shareholders in open dialogues and forums and keep them well-informed of significant developments of the Bank.
Considering the relevance and valid contribution made towards sound investor relations, our “Investor Relations” scope encompasses a range of other stakeholders in addition to shareholders. Investor engagement is done through a comprehensive range of investor relation activities, at certain instances with the aid of advance technological support, such that we are accessible to investors overseas as well.
2014 had an action packed schedule in the investor relations frontier, where we executed a number of interactive, comprehensive and open engagement activities. A highlight of the year was the Bank being recognized with a bronze award for best investor relations activities, by Chartered Financial Analysts (CFA) of Sri Lanka in their Capital Market Awards for 2014.
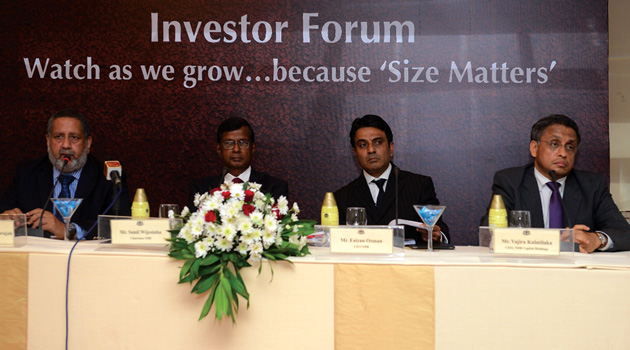
At the head table of the Investor Forum held in August 2014 (from left: Mr Rajendra Theagarajah - CEO of NDB, Mr Sunil G Wijesinha - Chairman of NDB, Mr Faizan Ozman - Group CFO of NDB and Mr Vajira Kulatilleke - CEO of NDB Capital Holdings PLC)
| Activity | Description |
| Annual General Meeting | The Bank hosts its Annual General meeting as per the regulatory requirements for the same. |
| One to one investor meetings | There is high accessibility to the senior management of the Bank for local and foreign investors. The Bank hosted over twenty one-to-one meetings during the year in Colombo with foreign investors. |
| Quarterly/Annual Financial Statements lodged to the Colombo Stock Exchange | The Bank ensures timely lodging of quarterly and annual financials to the Colombo Stock Exchange (CSE), within the statutory deadlines for such lodgings. |
| Email alerts sent to investors on financial results released | Our investors are notified of financial results released, immediately after the results are lodged with the CSE, each quarter. The notification is done via an email along with the quarterly financials and a performance commentary. An investor presentation is also uploaded to the Bank’s corporate website subsequently. |
| Quarterly and annual press releases on the financial performance of the Bank and the Group | A press release on the financial performance of the Bank and the Group is featured in three newspapers (in Sinhala, Tamil & English) subsequent to the release of quarterly and annual financial accounts to the CSE. |
| Investor Forums/On-line investor webinars | The Bank hosts an investor webinar and/or an investor forum as suitable for each quarter and financial year end, on the financial performance for the period under consideration. The Bank hosted two investor forums and three on-line investor webinars in Colombo during 2014. |
| Earnings calls | The Bank participates in earnings call as and when requested by individual investors. The Bank participated in one earnings call during the year. |
| Foreign Investor Forums | The Bank was one of the participants in Sri Lanka’s first ever capital markets investor forum “Invest Sri Lanka – Investor Forum” held in New York in September 2014. |
| Investor Relations webpage within the Bank’s corporate website | This webpage provides our target audience with a full spectrum of valuable information regarding the Bank’s equity and debt securities and other important aspects. |
| NDB Bank Shares | Quoted Ordinary Shares |
| Listed exchange | Colombo Stock Exchange (CSE) – Main Board |
| Featured stock indices | All Share Price Index (ASPI) |
| S&P (SL) 20 Index | |
| Bank Finance and Insurance (BFI) | |
| CSE Stock symbol | NDB.N0000 |
| ISIN | LK0207N00007 |
| Bloomberg newswire code | NDBB |
| Reuter’s newswire code | NBLK |
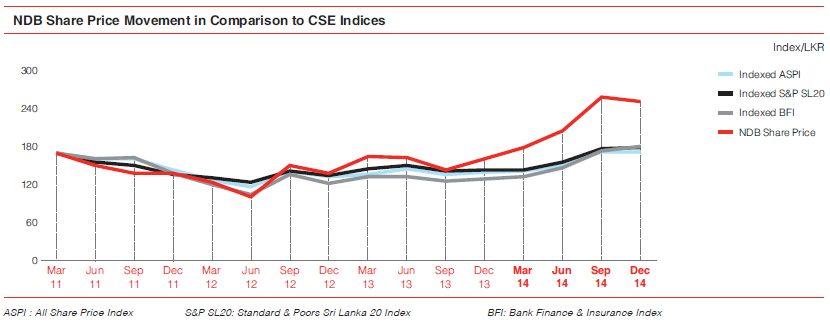
During 2014, the All Share Price Index (ASPI) grew by a significant 23.4% and closed at 7,298.95 on the 31 December 2014 while the Standard & Poor’s Sri Lanka 20 Index (S&P SL20) recorded a significant increase of 25.3% over the same period. Many milestones were achieved during the year with the S&P SL20 crossing the 4,000 mark for the first time since its inception, the ASPI crossing the 7,500 mark after a period of three and a half years and the market capitalization reaching LKR 3 trillion to close at LKR 3,104.9 million as at 31 December 2014. Additionally, the daily average turnover grew by approximately 71.0% over the year from LKR 828 million in 2013 to record LKR 1.415 billion in 2014.
The notable uptick in the market was mostly as a result of the dip in the treasury yields which reached an all-time low with the country’s objective to encourage private sector credit growth. This initiative increased investor preference to the share market due to higher returns in comparison to deposit rates.
Furthermore, expected economic development in the country over the past five years with the cessation of the civil war has attracted many foreign investors to the country. Foreign purchases reached an all-time high of LKR 105,812.5 million as at 31 December 2014.
Approximately LKR 77.7 billion was raised through debt and equity Initial Public Offerings (IPOs), rights issues, and private placements indicating that the primary market was commendably active during the year. During the course of 2014 there have been five Equity IPOs, one Equity Introduction, and 20 Debt offerings. The total raised from the five IPOs touched a three year high, with the total funds collected amounting to LKR 2,693.8 million.
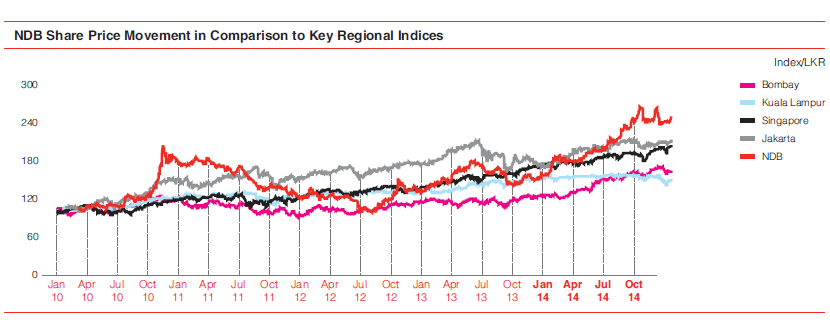
Furthermore, the country’s market is performing positively in comparison to global markets; ranking among the top six best performing markets internationally and within the five best performing markets in the region, in lieu of the ASPI’s 23.4% growth figure recorded for the year.
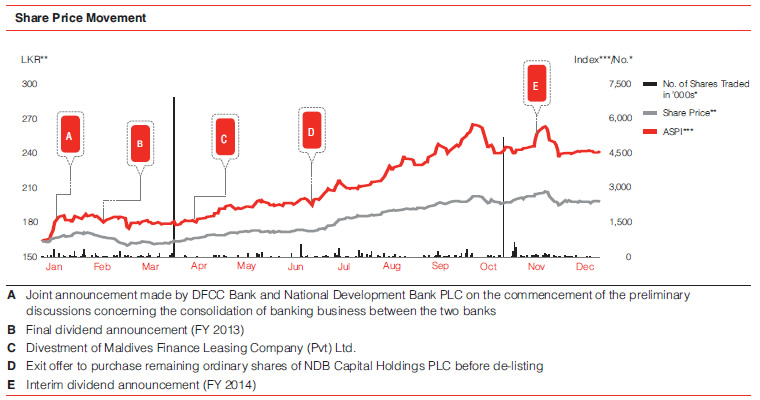
The NDB Bank share price surged by 55.8% during the year to close at LKR 250 as at 31 December 2014 from LKR 160.50 in the previous year, outperforming the ASPI by almost two times. During the year, the share reached a high of LKR 266 (in October 2014) and a low of LKR 160.50 (in January 2014). Additionally, 400,888 new shares were issued during the year through the Equity Linked Compensation Plan which did not have a significant impact on the market price.
The final dividend for 2013 of LKR 5.00 per share was announced in February 2014 and was paid in March 2014 while an interim dividend for 2014 of LKR 7.00 per share was announced in November 2014 and was paid in December 2014.
| As at 31 December 2014 | As at 31 December 2013 | |||||||||
| Shareholding Range | No. of Shareholders | % | No. of Shares | % | No. of Shareholders | % | No. of Shares | % | ||
| 1 | – | 1,000 | 5,039 | 62.88 | 1,693,820 | 1.03 | 5,212 | 67.73 | 1,760,740 | 1.07 |
| 1,001 | – | 10,000 | 2,536 | 31.64 | 8,047,949 | 4.87 | 2,048 | 26.61 | 6,352,964 | 3.86 |
| 10,001 | – | 100,000 | 351 | 4.38 | 9,678,179 | 5.86 | 346 | 4.50 | 10,076,661 | 6.12 |
| 100,001 | – | 1,000,000 | 59 | 0.74 | 18,393,531 | 11.14 | 61 | 0.80 | 20,039,880 | 12.17 |
| Over 1,000,000 | 29 | 0.36 | 127,280,443 | 77.10 | 28 | 0.36 | 126,462,789 | 76.78 | ||
| Total | 8,014 | 100.00 | 165,093,922 | 100.00 | 7,695 | 100.00 | 164,693,034 | 100.00 | ||
| As at 31 December 2014 | As at 31 December 2013 | |||||||
| Shareholding | No. of Shareholders | % | No. of Shares | % | No. of Shareholders | % | No. of Shares | % |
| Resident | 7,865 | 98.14 | 111,113,993 | 67.30 | 7,529 | 97.84 | 115,337,647 | 70.03 |
| Non-resident | 149 | 1.86 | 53,979,929 | 32.70 | 166 | 2.16 | 49,355,387 | 29.97 |
| Total | 8,014 | 100.00 | 165,093,922 | 100.00 | 7,695 | 100.00 | 164,693,034 | 100.00 |
| As at 31 December 2014 | As at 31 December 2013 | |||||||
| Shareholding | No. of Shareholders | % | No. of Shares | % | No. of Shareholders | % | No. of Shares | % |
| Individual | 7,604 | 94.88 | 32,875,619 | 19.91 | 7,243 | 94.13 | 30,769,120 | 18.68 |
| Institutional | 410 | 5.12 | 132,218,303 | 80.09 | 452 | 5.87 | 133,923,914 | 81.32 |
| Total | 8,014 | 100.00 | 165,093,922 | 100.00 | 7,695 | 100.00 | 164,693,034 | 100.00 |
| Twenty Largest Registered Shareholders as at 31 December 2014 | 2014 | 2013* | |||
| Name | No of Shares | % | No of Shares | % | |
| 1. | Bank of Ceylon No. 1 Account | 16,371,076 | 9.92 | 16,371,076 | 9.94 |
| 2. | Employees’ Provident Fund | 16,010,248 | 9.70 | 16,010,248 | 9.72 |
| 3. | Sri Lanka Insurance Corporation Ltd. - General Fund | 9,388,488 | 5.69 | 9,388,488 | 5.70 |
| 4. | HSBC International Nominees Ltd. - SNFE - NTAsian Discovery Master Fund | 8,973,856 | 5.44 | 8,432,154 | 5.12 |
| 5. | Dr. S Yaddehige | 8,669,000 | 5.25 | 8,669,000 | 5.26 |
| 6. | Sri Lanka Insurance Corporation Ltd. - Life Fund | 7,805,426 | 4.73 | 7,805,426 | 4.74 |
| 7. | HSBC International Nominees Ltd. - BPSS LUX - Aberdeen Global Asia Pacific Equity Fund | 5,715,450 | 3.46 | 5,715,450 | 3.47 |
| 8. | Employees’ Trust Fund Board | 5,303,700 | 3.21 | 5,303,700 | 3.22 |
| 9. | BNY-CF Ruffer Investment Funds: CF Ruffer Pacific Fund | 4,850,000 | 2.94 | 3,000,000 | 1.82 |
| 10. | HSBC International Nominees Ltd. - MSNY - BAY Pond Partners L.P. | 4,501,200 | 2.73 | 4,501,200 | 2.73 |
| 11. | HSBC International Nominees Ltd. - BP2S London - Aberdeen Asia Pacific Equity Fund | 4,294,800 | 2.60 | 0 | 0.00 |
| 12. | Hatton National Bank PLC A/C No. 01 | 4,282,200 | 2.59 | 4,282,200 | 2.60 |
| 13. | Asian Alliance Insurance PLC - Account Number 03/Life Shareholders’ Fund | 3,450,977 | 2.09 | 3,450,977 | 2.10 |
| 14. | Mr. A K Pathirage | 2,970,000 | 1.80 | 2,970,000 | 1.80 |
| 15. | Asian Alliance Insurance PLC - General Fund Account No. 01 | 2,540,977 | 1.54 | 2,540,977 | 1.54 |
| 16. | Asiri Hospital Holdings PLC | 2,411,583 | 1.46 | 2,411,583 | 1.46 |
| 17. | Asian Alliance Insurance PLC - A/C 02 (Life Fund) | 2,159,746 | 1.31 | 2,159,746 | 1.31 |
| 18. | HSBC International Nominees Ltd. - MSNY - BAY Pond Investors (Bermuda) LP | 2,045,200 | 1.24 | 2,045,200 | 1.24 |
| 19. | DFCC Bank A/C 1 | 2,000,000 | 1.21 | 2,000,000 | 1.21 |
| 20. | HSBC International Nominees Ltd. - BP2S London - Aberdeen Asia Smaller Companies Investment Trust | 1,683,000 | 1.02 | 1,683,000 | 1.02 |
| Total | 115,426,927 | 69.92 | 108,740,425 | 66.03 | |
*Comparative shareholdings as at 31 December 2013 is of the twenty largest shareholders as at 31 December 2013.
| 2014 | 2013 | |
| Percentage of shares held by the public* | 90.25% | 75.62% |
| Number of public shareholders** | 7,982 | – |
*The increase in the public holding percentage as at 31 December 2014 is largely owing to the change in the definition of the ‘public holding’ in the Listing Rules of the Colombo Stock Exchange with effect from the year 2014.
** As per the Listing Rules of the Colombo Stock Exchange applicable in the year 2013 there was no requirement to disclose the number of public shareholders as at the end of the said year.
| Name | As at 31 December 2014 No. of Shares |
As at 31 December 2013 No. of Shares |
| Sunil G Wijesinha | 880 | 880 |
| Ashok Pathirage | 3,993,000* | 3,993,000* |
| Rajendra Theagarajah | 126 | 126 |
| Trevine Jayasekera | – | – |
| Kimarli Fernando | – | – |
| Anura Siriwardana | – | – |
| Sarath Wikramanayake | – | – |
| G D Chandra Ekanayake | – | – |
| Sujeewa Rajapakse | – | – |
| Indrani Sugathadasa | – | – |
*Includes shares held in slash account
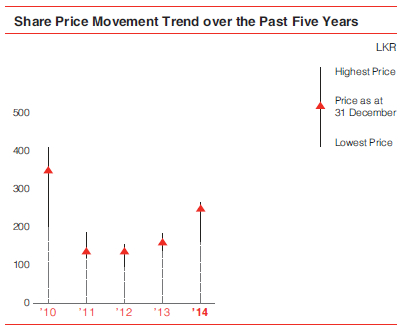
| Year | 2014 | 2013 | 2012 | 2011 | 2010 |
| Highest price (LKR) | 266.00 | 182.50 | 155.00 | 186.00 | 410.00 |
| Lowest price (LKR) | 160.50 | 138.00 | 96.00 | 120.00 | 202.00 |
| Price as at 31 December (LKR) | 250.00 | 160.50 | 137.90 | 138.10 | 349.50 |
| Total number of shares in issue | 165,093,922 | 164,693,034 | 164,201,902 | 164,201,902 | 82,100,951 |
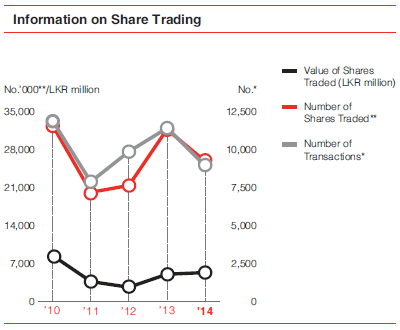
| Year | 2014 | 2013 | 2012 | 2011 | 2010 |
| (a) Number of transactions | 8,917 | 11,406 | 9,854 | 7,906 | 11,862 |
| (b) Number of shares traded | 25,871,855 | 31,631,020 | 21,406,492 | 20,108,047 | 32,390,146 |
| (c) Value of shares traded (LKR million) | 5,452 | 5,112 | 2,676 | 3,737 | 8,514 |
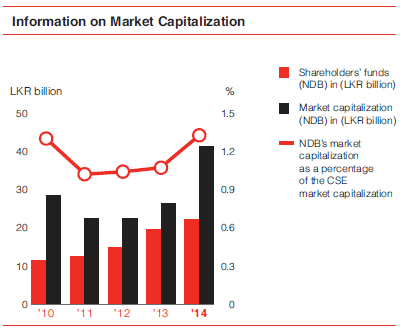
| Year | 2014 | 2013 | 2012 | 2011 | 2010 |
| Shareholder funds (NDB) in LKR million | 27,876 | 24,514 | 24,883 | 16,925 | 15,281 |
| Market capitalization (NDB) in LKR million | 41,273 | 26,433 | 22,643 | 22,676 | 28,694 |
| Market capitalization (CSE) in LKR million | 3,104,864 | 2,422,985 | 2,167,581 | 2,213,873 | 2,210,452 |
| NDBZs market capitalization as a percentage of CSE market capitalization | 1.33% | 1.09% | 1.04 % | 1.02% | 1.30% |
| Market capitalization rank of NDB | 16 | 20 | 22 | 23 | 20 |
| Beta values against ASPI | 1.30 | 0.97 | 0.73 | 0.86 | 1.18 |
| Beta values against S&P SL20 | 1.23 | 1.22 | 1.01 | 0.92 | 1.00 |
| Year | 2014 | 2013 | 2012 | 2011 | 2010 |
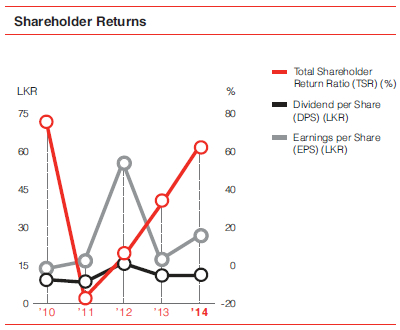
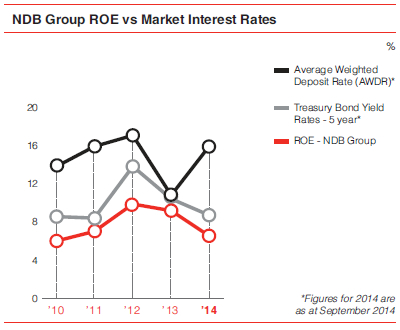
| Return on equity (%) | 15.78 | 10.70 | 42.35 | 15.69 | 14.72 |
| Earnings per share (EPS) (LKR) | 25.14 | 16.48 | 55.31 | 15.79 | 12.82 |
| Dividend per share (DPS) (LKR) | 11.00 | 10.00 | 15.00 | 7.50 | 8.50 |
| Dividend yield (%) | 4.40 | 6.23 | 10.88 | 5.43 | 4.86 |
| Dividend payout ratio (%) | 44.00 | 62.0 | 79.0 | 49.0 | 33.0 |
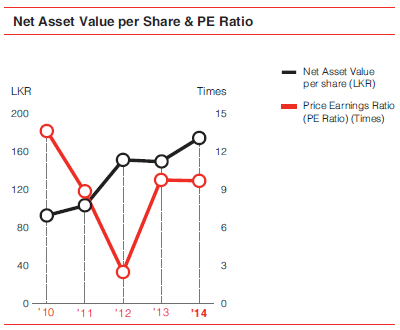
| Net asset value per share (LKR) | 169.35 | 148.85 | 151.54 | 103.08 | 93.06 |
| Price earnings ratio (PE ratio) (Times) | 9.94 | 9.74 | 2.49 | 8.75 | 13.63 |
| Price to book value (Times) | 1.44 | 1.08 | 0.91 | 1.34 | 1.88 |
| Total shareholder return ratio (TSR) (%) | 63.23 | 30.89 | 2.75 | (18.68) | 75.49 |
On 30 March 2010, shareholders of the Bank approved an Equity Linked Compensation Plan (ELCP), to enable the management staff in the rank of Assistant Vice-President and above of the Bank to take part in the voting ordinary share capital of the Bank, subject to certain limits, terms and conditions. As per the ELCP, the eligible members of the staff have exercised share options amounting to 400,888 shares during the year ended 31 December 2014. Accordingly, the said share issue resulted in the increase of the stated capital of the Bank from LKR 1,172.9 million to LKR 1,225.16 million and the number of shares in issue from 164,693,034 to 165,093,922 as at 31 December 2014.
The Colombo Stock Exchange (CSE), by Listing Rule 5.6 has amended the rules relating to Employee Share Option Schemes (ESOS) and Employee Share Purchase Schemes (ESPS) by mandating that such schemes should result in the shares being offered to eligible employees for ‘purchase’ or ‘subscription’ in the case of ESOS and ‘acquisition’ in the case of ESPS, specifically prohibiting open ended schemes. In compliance with this ruling and the Transitional Provisions thereto, the Board of Directors of National Development Bank PLC (NDB) approved the dissolution of the NDB ESOP Trust and the distribution of the ESOP shares amounting to 4,133,726 to the eligible employees of NDB.
In December 2013, the Bank issued by way of a public offer, one hundred million (100,000,000) rated, unsecured, subordinated, redeemable debentures (RUSRD) of the par value of rupees one hundred (LKR 100/-) each aggregating to the value of rupees ten thousand million (LKR 100,000,000,000/-).
The proceeds of these debentures were utilized to support the Bank’s Tier II capital.
| Type of Debentures | Debenture Code | ISIN | Nominal Interest Rate per Annum | Annual Effective Rate per Annum | Redemption (from the Date of Allotment) | Interest Payment Frequency | Interest Payment Dates |
| Type A | NDB/BC/19/12/18A13 | LK0207D20998 | 13.00% | 13.42% | 60 months (5 years) | Semi-Annually | 30 June & 31 December |
| Type B | NDB/BC/19/12/18B13.4 | LK0207D21012 | 13.40% | 13.40% | 60 months (5 years) | Annually | 31 December |
| Type C | NDB/BC/19/12/23C13.9 | LK0207D21038 | 13.90% | 13.90% | 120 months (10 years) | Annually | 31 December |
| Type D | NDB/BC/19/12/25D14 | LK0207D21053 | 14.00% | 14.00% | 144 months (12 years) | Annually | 31 December |
| Type of Debenture | Market Value | Interest Rate | ||||||||||
| CSE Listing | Interest payable frequency | Balance as at 31 December 2014 | Highest | Lowest | Quarter End | Coupon Rate | Effective Annual | Interest rate of Compa- rable | Interest Yield | Yield To Maturity | ||
| LKR million | LKR | LKR | LKR | % | Yield % | Security % | % | % | ||||
| Fixed Rate | ||||||||||||
| A - Dec. 2013/ Dec. 2018 |
Listed | Semi Annually | 1,243 | 119.53 | 100.00 | 119.53 | 13.00 | 13.42 | 9.78 | 7.25 | 7% | |
| B - Dec. 2013/ Dec. 2018 |
Listed | Annually | 1,529 | 112.26 | 111.28 | 112.26 | 13.40 | 13.40 | 9.78 | 9.58 | 10% | |
| C - Dec. 2013/ Dec. 2023 |
Listed | Annually | 3,638 | 118.1 | 112.5 | 117.38 | 13.90 | 13.90 | 11.00 | 10.78 | 10.78 | |
| D - Dec. 2013/ Dec. 2025 |
Listed | Annually | 3,590 | 119.95 | 119.23 | 119.95 | 14.00 | 14.00 | 11.39 | 10.90 | 10.9 | |
| Total Debentures | 10,000 | |||||||||||
In 2011, the Bank privately placed rated subordinated unsecured unlisted debentures having an aggregate face value of LKR 400,000,000/-. The proceeds of these debentures were utilized for re-lending purposes. The details of the said debentures are as follows:
| Date | Amount LKR | Number of Debentures | Value LKR | Redemption | Rate of interest |
| 30 June 2011 | 1,000/- each | 110,000 | 110,000,000 | 30 June 2016 | 03 month gross TBR* + 1.00% per annum |
| 22 July 2011 | 1,000/- each | 290,000 | 290,000,000 | 30 June 2016 | 03 month gross TBR* + 1.00% per annum |
*Treasury Bill Rate.
| Type of Debenture | CSE Listing | Interest payable frequency | Balance as at 31 December 2014 | Coupon Rate | Effective Annual | Interest rate of Comparable | |
| LKR million | % | Yield % | Security % | ||||
| Floating Rate | |||||||
| 2011- 2016 (3 month TB* rate (gross)+1% p.a.) |
Unlisted | Quarterly | 400 | 11.43 | 11.93 | 7.78 | |
| Total Debentures | 400 |
* Three months Treasury Bill rate before deducting 10% Withholding tax as published by the Central Bank of Sri Lanka has been used.
| 2014 | 2013 | |
| Debt Equity Ratio (Times) | 10.43 | 8.99 |
| Interest cover (Times) | 1.58 | 1.49 |
| Liquidity Assets Ratio (%) – Domestic Banking Unit | 23.85 | 26.22 |
| Liquidity Assets Ratio (%) – Foreign Currency Banking Unit | 25.18 | 26.06 |
| Name | As at 31 December 2014 No of Debentures |
As at 31 December 2013 No of Debentures |
| Sunil G Wijesinha | 10,000 | 10,000 |
| Ashok Pathirage | – | – |
| Rajendra Theagarajah | – | – |
| Trevine Jayasekera | – | – |
| Kimarli Fernando | – | – |
| Anura Siriwardana | – | – |
| Sarath Wikramanayake | – | – |
| G D Chandra Ekanayake | – | – |
| Sujeewa Rajapakse | – | – |
| Indrani Sugathadasa | – | – |
| 11.1 | Rating entity | Fitch Ratings |
| Date of report | 23 June 2014 | |
| National long-term rating | AA- (lka)/Stable outlook | |
| Outstanding subordinated debentures | A+ (lka) | |
| Long-term foreign currency & local currency issuer default ratings (IDR) | B+/Stable outlook | |
| Short-term foreign currency IDR | B | |
| Viability rating | b+ | |
| Support rating | 4 | |
| Support rating floor | B | |
| 11.2 | Rating entity | Standard & Poor's Ratings Services |
| Date of report | 27 June 2014 | |
| Counterparty Credit Rating | B+/Stable/B | |
| Counterparty Credit Ratings History (26 June 2013) | B+/Stable/B |
There have been no changes to the ratings issued in 2014 in comparison to ratings issued in the prior year.
Please refer our Investor Relations web page within the NDB Corporate website on http://www.ndbbank.com to read full rating reports of Fitch Ratings and Standard and Poor’s Rating Services.
| BANK | GROUP | |||||
| For the year ended 31 December | 2014
US$ ’000 |
2013
US$ ’000 |
Change % | 2014
US$ ’000 |
2013
US$ ’000 |
Change % |
| Gross income | 190,870 | 229,672 | 200,372 | 195,960 | ||
| Interest income | 160,381 | 159,250 | 1 | 161,737 | 160,503 | 1 |
| Interest expenses | 101,698 | 106,597 | (5) | 101,228 | 106,309 | (5) |
| Net interest income | 58,683 | 52,653 | 11 | 60,509 | 54,194 | 12 |
| Fee and commission income | 14,270 | 12,476 | 14 | 19,606 | 18,674 | 5 |
| Net gains/(losses) from trading | 6,958 | 7,383 | (6) | 6,958 | 7,383 | (6) |
| Net gain/(loss) from financial investments | 5,479 | 2,446 | 124 | 10,173 | 7,086 | 44 |
| Other operating income | 3,782 | 47,666 | (92) | 1,897 | 1,928 | (2) |
| Total operating income | 89,172 | 122,623 | (27) | 99,143 | 89,264 | 11 |
| Impairment for loans and receivables and other losses | 4,328 | 9,570 | (55) | 4,043 | 9,745 | (59) |
| Net operating income | 84,844 | 113,053 | (25) | 95,100 | 79,519 | 20 |
| Less: Operating expenses | ||||||
| Personnel expenses | 21,966 | 18,466 | 19 | 24,257 | 20,562 | 18 |
| Other expenses | 18,630 | 19,748 | (6) | 20,938 | 22,442 | (7) |
| Total operating expenses | 40,596 | 38,214 | 6 | 45,195 | 43,004 | 5 |
| Operating profit before tax on financial services | 44,248 | 74,839 | (41) | 49,905 | 36,515 | 37 |
| Tax on financial services | (7,870) | (7,037) | 12 | (7,870) | (7,037) | 12 |
| Operating profit after tax on financial services | 36,378 | 67,802 | (46) | 42,035 | 29,478 | 43 |
| Share of associate companies’ profits/(losses) | – | – | – | 744 | 380 | 96 |
| Profit before taxation | 36,378 | 67,802 | (46) | 42,779 | 29,858 | 43 |
| Taxation | (10,242) | (8,106) | 26 | (10,313) | (8,895) | 16 |
| Profit for the year | 26,136 | 59,696 | (56) | 32,466 | 20,963 | 55 |
| Profit attributable to: | ||||||
| Equity holders of the parent | 26,136 | 59,696 | (56) | 31,610 | 20,420 | 55 |
| Non-controlling interests | – | – | – | 856 | 543 | 58 |
| 26,136 | 59,696 | (56) | 32,466 | 20,963 | 55 | |
| BANK | GROUP | |||||
| For the year ended 31 December | 2014 US$ ’000 |
2013 US$ ’000 |
Change % | 2014 US$ ’000 |
2013 US$ ’000 |
Change % |
| Profit for the year | 26,136 | 59,696 | (56) | 32,466 | 20,963 | 55 |
| Other comprehensive income/(expenses) to be reclassified to profit or loss insubsequent periods | ||||||
| Exchange differences on translation of foreign operations | – | – | – | 4 | (86) | 100 |
| Net gains and losses on Available-for-Sale investments | (268) | 1,147 | (123) | (168) | 1,620 | (110) |
| Gains and losses on cash flow hedges | 3,042 | – | 100 | 3,042 | – | 100 |
| Other comprehensive income /(expenses) not to be reclassified to profit or loss insubsequent periods | ||||||
| Revaluation of freehold land & buildings | 8,290 | – | 100 | 8,290 | – | 100 |
| Actuarial losses on defined benefit plans | (1,068) | (276) | 286 | (1,068) | (274) | 289 |
| Total other comprehensive income | 9,996 | 871 | 1,048 | 10,100 | 1,259 | 702 |
| Less: Tax expenses relating to components of other comprehensive income | (1,377) | (295) | 367 | (1,377) | (429) | 224 |
| Other comprehensive income for the year, net of taxes | 8,619 | 576 | 1,396 | 8,723 | 830 | 949 |
| Total comprehensive income for the year | 34,755 | 60,270 | (42) | 41,189 | 21,793 | 89 |
| Attributable to: | ||||||
| Equity holders of the parent | 34,755 | 60,270 | (42) | 40,331 | 21,250 | 90 |
| Non-controlling interest | – | – | – | 858 | 534 | 61 |
| 34,755 | 60,270 | (42) | 41,189 | 21,793 | 89 | |
| BANK | GROUP | ||||||
| As at 31 December | Note | 2014
US$ ’000 |
2013
US$ ’000 |
Change % | 2014
US$ ’000 |
2013
US$ ’000 |
Change % |
| Assets | |||||||
| Cash and cash equivalents | 23,536 | 19,970 | 18 | 24,822 | 20,407 | 22 | |
| Balances with Central Bank | 51,104 | 40,834 | 25 | 51,104 | 40,834 | 25 | |
| Placements with banks | 20,636 | 1,000 | 1,964 | 20,636 | 1,000 | 1,964 | |
| Derivative financial instruments | 14,434 | 8,792 | 64 | 14,434 | 8,792 | 64 | |
| Financial assets held-for-trading | 21,117 | 81,994 | (74) | 45,706 | 108,559 | (58) | |
| Loans and receivables to banks | 2,359 | 4,907 | (52) | 2,359 | 4,907 | (52) | |
| Loans and receivables to other customers | 1,328,091 | 1,046,436 | 27 | 1,328,551 | 1,046,896 | 27 | |
| Financial investments - loans and receivables | 290,390 | 121,128 | 140 | 293,279 | 128,426 | 128 | |
| Financial investments - Available-for-Sale | 129,343 | 45,755 | 183 | 136,906 | 47,170 | 190 | |
| Financial investments - held-to-maturity | 68,013 | 134,625 | (49) | 77,084 | 141,190 | (45) | |
| Investments held for sale | 140 | – | 100 | 252 | – | 100 | |
| Investments in subsidiary companies | 15,165 | 15,584 | (3) | – | – | – | |
| Investments in associate companies | – | 474 | (100) | – | 587 | (100) | |
| Investment property | – | – | – | 11,719 | 10,583 | 11 | |
| Intangible assets | 1,919 | 1,992 | (4) | 2,252 | 2,269 | (1) | |
| Property, plant & equipment | 14,613 | 6,676 | 119 | 17,078 | 8,998 | 90 | |
| Other assets | 11,021 | 9,097 | 21 | 14,224 | 11,157 | 28 | |
| Total assets | 1,991,881 | 1,539,263 | 29 | 2,040,406 | 1,581,775 | 29 | |
| Liabilities | |||||||
| Due to banks | 53,293 | 79,947 | (33) | 53,293 | 79,947 | (33) | |
| Derivative financial instruments | 5,028 | 6,251 | (20) | 5,028 | 6,251 | (20) | |
| Due to other customers | 1,151,052 | 992,964 | 16 | 1,148,485 | 989,842 | 16 | |
| Debt securities issued and other borrowed funds | 469,715 | 186,775 | 151 | 469,491 | 186,545 | 152 | |
| Tax liabilities | 6,268 | 2,035 | 208 | 6,112 | 2,296 | 166 | |
| Deferred tax liabilities | 4,696 | 2,390 | 97 | 4,624 | 2,481 | 86 | |
| Employee benefit liabilities | 1,873 | 1,300 | 44 | 2,199 | 1,643 | 34 | |
| Other liabilities | 46,828 | 28,189 | 66 | 48,309 | 29,448 | 64 | |
| Subordinated term debts | 84,529 | 89,351 | (5) | 84,529 | 89,351 | (5) | |
| Total liabilities | 1,823,282 | 1,389,202 | 31 | 1,822,070 | 1,387,805 | 31 | |
| Equity | |||||||
| Stated capital | 9,289 | 8,971 | 4 | 8,683 | 7,218 | 20 | |
| Statutory reserve fund | 7,663 | 7,331 | 5 | 7,663 | 7,331 | 5 | |
| Retained earnings | 141,209 | 119,719 | 18 | 183,820 | 158,561 | 16 | |
| Other reserves | 10,438 | 14,040 | (26) | 11,174 | 14,377 | (22) | |
| Total equity to equity holders of the Bank | 168,599 | 150,061 | 0 | 211,340 | 187,486 | 18 | |
| Non-controlling interest | – | – | 6,996 | 6,484 | 8 | ||
| Total equity | 168,599 | 150,061 | 12 | 218,336 | 193,971 | 13 | |
| Total liabilities and total equity | 1,991,881 | 1,539,263 | 29 | 2,040,406 | 1,581,775 | 29 | |
| Commitments and contingencies | 1,752,416 | 1,355,260 | 29 | 1,752,455 | 1,355,260 | 29 | |
The Statement of profit or loss, Statement of Comprehensive Income and the Statement of Financial Position given in USD are solely for the shareholders, investors and any other users of financial information and do not form part of the audited Financial Statements.
| BANK
LKR ’000 |
Quarter 4 31.12.2014 | Quarter 3 30.09.2014 | Quarter 2 30.06.2014 | Quarter 1 31.03.2014 | Quarter 4 31.12.2013 | Quarter 3 30.09.2013 | Quarter 2 30.06.2013 | Quarter 1 31.03.2013 |
| Net interest income | 1,893,935 | 2,011,647 | 1,973,188 | 1,795,831 | 1,811,582 | 1,811,528 | 1,793,005 | 1,575,021 |
| Other operating income | 889,176 | 909,803 | 898,997 | 1,289,390 | 831,892 | 779,357 | 747,425 | 6,517,490 |
| Total operating income | 2,783,111 | 2,921,450 | 2,872,185 | 3,085,221 | 2,643,474 | 2,590,885 | 2,540,430 | 8,092,511 |
| Impairment for loans and receivables and other losses | 242,428 | 101,449 | 193,633 | 28,493 | 1,012,095 | 77,202 | 98,735 | 50,171 |
| Net operating income | 2,540,683 | 2,820,001 | 2,678,552 | 3,056,728 | 1,631,379 | 2,513,683 | 2,441,695 | 8,042,340 |
| Total operating expenses | 1,393,055 | 1,378,336 | 1,229,405 | 1,308,396 | 1,330,607 | 1,281,566 | 1,177,257 | 1,154,773 |
| Profit from operations | 1,147,628 | 1,441,665 | 1,449,147 | 1,748,332 | 300,772 | 1,232,117 | 1,264,438 | 6,887,567 |
| Share of associate companies' profit | – | – | – | – | – | – | – | – |
| Profit before taxation | 1,147,628 | 1,441,665 | 1,449,147 | 1,748,332 | 300,772 | 1,232,117 | 1,264,438 | 6,887,567 |
| Taxation | (547,209) | (502,867) | (769,134) | (549,500) | (131,775) | (538,804) | (672,704) | (618,375) |
| Profit for the period | 600,419 | 938,798 | 680,013 | 1,198,832 | 168,997 | 693,313 | 591,734 | 6,269,192 |
| Profit attributable to: | ||||||||
| Equity holders of the parent | 600,419 | 938,798 | 680,013 | 1,198,832 | 168,997 | 693,313 | 591,734 | 6,269,192 |
| Non-controlling interests | – | – | – | – | – | – | – | – |
| 600,419 | 938,798 | 680,013 | 1,198,832 | 168,997 | 693,313 | 591,734 | 6,269,192 | |
| Basic earnings per share (in LKR) |
3.64 | 5.69 | 4.02 | 5.78 | 1.03 | 4.21 | 3.60 | 38.18 |
| Diluted earnings per share (in LKR) |
3.63 | 5.68 | 4.01 | 5.78 | 1.03 | 4.21 | 3.60 | 38.18 |
| Group
LKR ’000 |
Quarter 4 31.12.2014 | Quarter 3 30.09.2014 | Quarter 2 30.06.2014 | Quarter 1 31.03.2014 | Quarter 4 31.12.2013 | Quarter 3 30.09.2013 | Quarter 2 30.06.2013 | Quarter 1 31.03.2013 |
| Net interest income | 1,952,090 | 2,064,925 | 2,033,432 | 1,862,959 | 1,782,679 | 1,858,010 | 1,836,605 | 1,608,231 |
| Other operating income | 1,341,065 | 1,309,395 | 1,035,734 | 1,366,455 | 1,443,552 | 1,067,697 | 1,089,447 | 865,197 |
| Total operating income | 3,293,155 | 3,374,320 | 3,069,166 | 3,229,414 | 3,226,231 | 2,925,707 | 2,926,052 | 2,473,427 |
| Impairment charges for loans and other losses | 222,964 | 85,776 | 94,385 | 125,584 | 1,055,348 | 83,201 | 98,735 | 23,480 |
| Net operating income | 3,070,191 | 3,288,544 | 2,974,781 | 3,103,830 | 2,170,883 | 2,842,506 | 2,827,317 | 2,449,948 |
| Total operating expenses | 1,605,584 | 1,522,422 | 1,349,455 | 1,433,155 | 1,524,781 | 1,408,122 | 1,309,853 | 1,322,364 |
| Profit from operations | 1,464,607 | 1,766,122 | 1,625,326 | 1,670,675 | 646,102 | 1,434,384 | 1,517,464 | 1,127,584 |
| Share of associate companies' profit | – | – | – | 97,274 | 9,562 | 28,980 | 8,210 | 2,468 |
| Profit before taxation | 1,464,607 | 1,766,122 | 1,625,326 | 1,767,949 | 655,664 | 1,463,364 | 1,525,674 | 1,130,051 |
| Taxation | (527,635) | (514,722) | (772,596) | (563,080) | (155,537) | (558,259) | (718,646) | (630,088) |
| Profit for the period | 936,972 | 1,251,400 | 852,730 | 1,204,869 | 500,127 | 905,105 | 807,028 | 499,964 |
| Profit attributable to: | ||||||||
| Equity holders of the parent | 857,660 | 1,242,340 | 843,045 | 1,190,885 | 445,319 | 891,961 | 797,753 | 506,888 |
| Non-controlling interest | 79,312 | 9,060 | 9,685 | 13,984 | 54,808 | 13,144 | 9,275 | (6,924) |
| 936,972 | 1,251,400 | 852,730 | 1,204,869 | 500,127 | 905,105 | 807,028 | 499,964 | |
| Basic earnings per share (in LKR) |
5.68 | 7.75 | 5.24 | 7.41 | 2.78 | 5.42 | 4.98 | 1.06 |
| Diluted earnings per share (in LKR) |
5.34 | 7.62 | 5.24 | 7.41 | 2.77 | 5.41 | 4.99 | 1.07 |
| BANK
LKR ’000 |
As at 31.12.2014 |
As at 30.09.2014 |
As at 30.06.2014 |
As at 31.03.2014 |
As at 31.12.2013 |
As at 30.09.2013 |
As at
30.06.2013 |
As at
31.03.2013 |
| Cash and cash equivalents | 12,566,872 | 19,509,158 | 9,162,267 | 8,361,127 | 8,080,826 | 8,746,703 | 15,224,455 | 16,863,330 |
| Net loans and receivables | 175,486,347 | 164,951,727 | 153,743,532 | 145,414,432 | 153,300,614 | 138,392,710 | 129,713,266 | 124,412,209 |
| Investments | 69,137,785 | 64,784,042 | 66,953,926 | 50,778,802 | 36,361,300 | 33,490,390 | 31,097,184 | 28,680,784 |
| Other assets | 5,538,140 | 5,603,313 | 3,522,678 | 2,884,388 | 3,393,034 | 2,595,732 | 4,257,589 | 3,484,992 |
| Total | 262,729,144 | 254,848,240 | 233,382,403 | 207,438,749 | 201,135,774 | 183,225,534 | 180,292,494 | 173,441,316 |
| Customer deposits | 151,823,715 | 150,515,133 | 139,500,487 | 135,282,343 | 129,830,029 | 118,489,102 | 117,639,980 | 110,091,898 |
| Borrowings | 80,134,243 | 74,010,835 | 66,633,874 | 47,287,695 | 46,556,578 | 39,878,258 | 36,845,563 | 36,879,823 |
| Other liabilities | 8,532,996 | 7,408,478 | 6,660,594 | 4,964,604 | 5,093,626 | 4,682,789 | 6,404,693 | 7,721,034 |
| Shareholders Funds | 22,238,190 | 22,913,794 | 20,587,448 | 19,904,106 | 19,655,542 | 20,175,384 | 19,402,258 | 18,748,561 |
| Total | 262,729,144 | 254,848,240 | 233,382,403 | 207,438,749 | 201,135,774 | 183,225,533 | 180,292,494 | 173,441,316 |
| Net asset value | 134.70 | 138.84 | 124.77 | 120.84 | 119.13 | 122.50 | 118.16 | 114.18 |
| Group
LKR ’000 |
As at
31.12.2014 |
As at
30.09.2014 |
As at 30.06.2014 |
As at
31.03.2014 |
As at 31.12.2013 |
As at
30.09.2013 |
As at
30.06.2013 |
As at
31.03.2013 |
| Cash and cash equivalents | 12,736,516 | 19,593,374 | 9,356,993 | 8,464,024 | 8,138,013 | 8,794,081 | 15,285,968 | 17,108,941 |
| Net loans and receivables | 175,547,049 | 164,945,855 | 153,767,778 | 145,472,939 | 137,523,341 | 138,663,070 | 130,152,065 | 125,004,814 |
| Investments | 72,970,512 | 68,607,489 | 70,575,810 | 54,259,369 | 55,690,627 | 36,401,141 | 33,578,308 | 30,834,571 |
| Other assets | 7,875,528 | 7,690,060 | 5,474,132 | 4,856,066 | 5,465,140 | 4,448,933 | 6,200,663 | 5,315,740 |
| Total | 269,129,605 | 260,836,778 | 239,174,713 | 213,052,398 | 206,817,121 | 188,307,225 | 185,217,004 | 178,264,066 |
| Customer deposits | 151,485,202 | 150,211,397 | 139,226,384 | 134,984,443 | 129,421,813 | 118,094,538 | 117,290,318 | 109,742,736 |
| Borrowings | 80,104,583 | 74,026,906 | 66,605,559 | 47,257,695 | 46,526,578 | 39,841,559 | 36,800,553 | 36,850,288 |
| Other liabilities | 8,741,401 | 7,536,486 | 6,926,198 | 5,219,171 | 5,507,076 | 4,819,685 | 6,560,392 | 7,940,684 |
| Shareholders’ funds | 27,875,773 | 28,218,815 | 25,582,366 | 24,730,358 | 24,513,808 | 24,757,448 | 23,785,039 | 22,926,435 |
| Non-controlling interest | 922,646 | 843,174 | 834,206 | 860,731 | 847,846 | 793,995 | 780,702 | 803,923 |
| Total | 269,129,605 | 260,836,778 | 239,174,713 | 213,052,398 | 206,817,121 | 188,307,225 | 185,217,004 | 178,264,066 |
| Net asset value | 169.35 | 175.92 | 159.51 | 154.00 | 148.85 | 150.32 | 144.85 | 139.62 |
| LKR million | 2005 | 2006 | 2007 | 2008 | 2009 | 2010 | 2011 | 2012 | 2013 | 2014 |
| Income | ||||||||||
| Net interest income | 2,693 | 2,853 | 3,522 | 3,787 | 4,233 | 4,163 | 4,910 | 5,896 | 7,012 | 7,913 |
| Other operating income | 2,081 | 2,133 | 1,474 | 1,662 | 2,560 | 2,785 | 3,012 | 9,042 | 4,537 | 5,053 |
| Total operating income | 4,774 | 4,986 | 4,997 | 5,449 | 6,793 | 6,948 | 7,922 | 14,938 | 11,549 | 12,966 |
| Impairment for loans & receivables and other losses | 153 | 13 | 65 | 116 | 373 | (172) | (88) | 51 | 1,261 | 529 |
| Net operating income | 4,621 | 4,972 | 4,932 | 5,333 | 6,420 | 7,119 | 8,010 | 14,887 | 10,288 | 12,437 |
| Less Operating Expenses | ||||||||||
| Personnel costs | 1,132 | 830 | 949 | 1,151 | 1,300 | 1,567 | 2,118 | 2,333 | 2,660 | 3,172 |
| Other operating costs | 1,645 | 929 | 1,104 | 1,237 | 1,370 | 1,496 | 1,863 | 2,163 | 2,904 | 2,738 |
| Total operating expenses | 2,777 | 1,760 | 2,053 | 2,388 | 2,670 | 3,063 | 3,981 | 4,496 | 5,564 | 5,910 |
| Operating Profit before Share of associate Companies profit before tax | 1,844 | 3,213 | 2,879 | 2,945 | 3,750 | 4,056 | 4,030 | 10,391 | 4,724 | 6,527 |
| Share of associate Companies profit | 22 | 214 | 179 | 172 | 526 | 295 | 331 | 439 | 49 | 97 |
| Profit before taxation | 1,866 | 3,427 | 3,058 | 3,118 | 4,276 | 4,351 | 4,361 | 10,830 | 4,773 | 6,624 |
| Taxation | (593) | (1,220) | (1,421) | (1,409) | (2,154) | (2,175) | (1,597) | (1,898) | (2,061) | (2,378) |
| Profit after taxation | 1,273 | 2,207 | 1,637 | 1,708 | 2,121 | 2,176 | 2,764 | 8,932 | 2,712 | 4,246 |
| Minority interest | (237) | (176) | (115) | (103) | (37) | (73) | (235) | (78) | (70) | (112) |
| Profit attributable to equity holders of the parent | 1,036 | 2,030 | 1,521 | 1,605 | 2,085 | 2,103 | 2,528 | 8,854 | 2,642 | 4,134 |
| LKR million | 2005 | 2006 | 2007 | 2008 | 2009 | 2010 | 2011 | 2012 | 2013 | 2014 |
| Assets | ||||||||||
| Liquid assets | 2,917 | 6,042 | 7,748 | 5,883 | 8,243 | 5,586 | 7,651 | 13,269 | 8,139 | 12,737 |
| Investments | 19,078 | 12,170 | 14,701 | 18,509 | 32,128 | 20,021 | 27,359 | 32,499 | 55,614 | 72,971 |
| Loans and receivables | 36,976 | 42,418 | 49,818 | 54,589 | 54,107 | 78,452 | 102,019 | 124,311 | 137,523 | 175,547 |
| Investments in associate companies | 241 | 1,179 | 1,210 | 1,393 | 1,724 | 1,763 | 1,797 | 33 | 77 | – |
| Property, plant & equipment | 1,162 | 691 | 804 | 781 | 806 | 918 | 1,504 | 1,541 | 1,473 | 2,550 |
| Investment property | 1,041 | 1,200 | 1,200 | 1,200 | 1,200 | 1,200 | 1,296 | 1,296 | 1,384 | 1,546 |
| Other assets | 3,006 | 1,276 | 661 | 925 | 1,075 | 691 | 962 | 1,154 | 2,608 | 3,780 |
| Goodwill | 873 | – | – | – | 4 | 4 | – | – | ||
| Total Assets | 65,295 | 64,977 | 76,143 | 83,280 | 99,286 | 108,635 | 142,588 | 174,103 | 206,818 | 269,130 |
| Liabilities | ||||||||||
| Borrowings | 27,799 | 29,204 | 34,147 | 34,993 | 29,561 | 28,631 | 38,973 | 36,630 | 47,344 | 80,104 |
| Deposits with customers | 13,954 | 21,161 | 25,624 | 31,091 | 49,948 | 60,533 | 82,094 | 107,394 | 129,423 | 151,485 |
| Non-life insurance reserves | 859 | – | – | – | – | – | – | – | – | |
| Long-term insurance fund | 9,238 | – | – | – | – | – | – | – | – | |
| Taxation | 220 | 640 | 522 | 352 | 560 | 633 | 397 | 713 | 625 | 1,416 |
| Other liabilities | 2,855 | 2,091 | 2,750 | 3,614 | 4,334 | 2,826 | 3,286 | 3,657 | 4,062 | 7,326 |
| Total Liabilities | 54,925 | 53,096 | 63,043 | 70,050 | 84,403 | 92,623 | 124,750 | 148,394 | 181,454 | 240,331 |
| Shareholders’ Funds | ||||||||||
| Stated capital | 760 | 1,033 | 1,033 | 1,033 | 1,033 | 864 | 864 | 864 | 944 | 1,145 |
| Statutory reserves | 546 | 819 | 819 | 819 | 819 | 879 | 879 | 879 | 959 | 1,011 |
| Other reserves | – | – | – | – | – | – | 387 | 924 | 1,880 | 1,474 |
| Retained earnings | 7,850 | 8,715 | 9,833 | 10,811 | 12,345 | 13,552 | 14,796 | 22,216 | 20,733 | 24,246 |
| Total shareholders' funds | 9,155 | 10,567 | 11,685 | 12,662 | 14,197 | 15,295 | 16,926 | 24,883 | 24,516 | 27,876 |
| Minority interest | 1,215 | 1,314 | 1,415 | 568 | 687 | 717 | 913 | 826 | 848 | 923 |
| Total funds employed | 10,370 | 11,881 | 13,100 | 13,230 | 14,883 | 16,012 | 17,838 | 25,709 | 25,364 | 28,799 |
| Total liabilities & funds employed | 65,295 | 64,977 | 76,143 | 83,280 | 99,286 | 108,635 | 142,588 | 174,103 | 206,818 | 269,130 |
14.3 Share Information |
||||||||||
| Market price per share (LKR) | 215.00 | 201.00 | 170.00 | 86.00 | 206.00 | 174.50 | 138.10 | 138.10 | 161.50 | 250.00 |
| Basic earnings per share (LKR) | 11.20 | 12.40 | 9.30 | 9.80 | 12.75 | 12.81 | 15.79 | 55.31 | 16.48 | 25.14 |
| Interim dividends per share (LKR) | – | – | – | – | – | 4.00 | 3.50 | 5.00 | 5.00 | 7.00 |
| Final dividends per share (LKR) | 6.00 | 4.00 | 6.00 | 6.75 | 8.00 | 4.50 | 4.00 | 10.00 | 5.00 | 4.00 |
| Total dividends per share | 6.00 | 4.00 | 6.00 | 6.75 | 8.00 | 8.50 | 7.50 | 15.00 | 10.00 | 11.00 |
| Dividend cover (Times) | 3.21 | 6.20 | 3.72 | 3.27 | 3.77 | 2.19 | 2.05 | 3.69 | 1.65 | 2.29 |
| Price earnings ratio (Times) | 9.95 | 8.10 | 9.14 | 4.39 | 8.08 | 13.63 | 8.97 | 2.56 | 9.74 | 9.94 |
| Book value per share (LKR) | 79.80 | 64.54 | 71.38 | 77.35 | 86.72 | 93.15 | 103.08 | 151.54 | 148.85 | 169.35 |
Tabulated below is how we complied with the Contents of the Annual Report as specified in Section 7.6 of the Listing Rules issued by the Colombo Stock Exchange. The table provides the disclosure requirements of Section 7.6, the compliance level of the Bank and where you will find the respective disclosures within this Annual Report.
| Rule No: | Disclosure Requirement |
| 7.6 (i) | Names of persons, who during the financial year, were Directors of the Entity |
| 7.6 (ii) | Principal activities of the Entity and its subsidiaries during the year and any changes therein |
| 7.6 (iii) | The names and the number of shares held by the 20 largest holders of voting shares and the percentage of such shares held |
| 7.6 (iv) | The Public Holding percentage |
| 7.6 (v) | A statement of each Director’s holding and Chief Executive Officer’s holding in shares of the Entity at the beginning and end of the financial year |
| 7.6 (vi) | Information pertaining to material foreseeable risk factors of the Entity |
| 7.6 (vii) | Details of material issues pertaining to employees and industrial relations of the Entity |
| 7.6 (viii) | Extents, locations, valuations and the number of buildings of the Entity’s land holdings and investment properties |
| 7.6 (ix) | Number of shares representing the Entity’s stated capital |
| 7.6 (x) | A distribution schedule of the number of holders in each class of equity securities, and the percentage of their total holdings |
| 7.6 (xi) | Ratios and Market Price Information |
|
|
|
|
|
|
| 7.6 (xii) | Significant changes in the Entitys or its subsidiaries fixed assets and the market value of land, if the value differs substantially from the book value |
| 7.6 (xiii) | Details of the funds raised either through a public issue, Rights Issue or private placement;
|
| 7.6 (xiv) | Employee share option scheme details Employee share purchase schemes |
| 7.6 (xv) | Disclosures pertaining to Corporate Governance practices in terms of Rules 7.10.3, 7.10.5 c. and 7.10.6 c. of Section 7 of the Rules. |
| 7.6 (xvi) | Related party transactions exceeding 10% of the Equity or 5% of the total assets of the Entity as per Audited Financial Statements, whichever is lower |
| Investor Relations Team
Ms. Suvendrini Muthukumarana Assistant Vice-President Tel.: + 94 112 448 448 / Ext. 3817 Fax: + 94 112 341 047 Email: investor.relations@ndbbank.com |
Company Secretariat
Ms. Shehani Ranasinghe Company Secretary Tel.: + 94 112 448 448 / Ext. 3080 Fax: + 94 112 341 050 Email: shehani.ranasinghe@ndbbank.com |
| Address: National Development Bank PLC, No. 40, Navam Mawatha, Colombo 02, Sri Lanka. | |